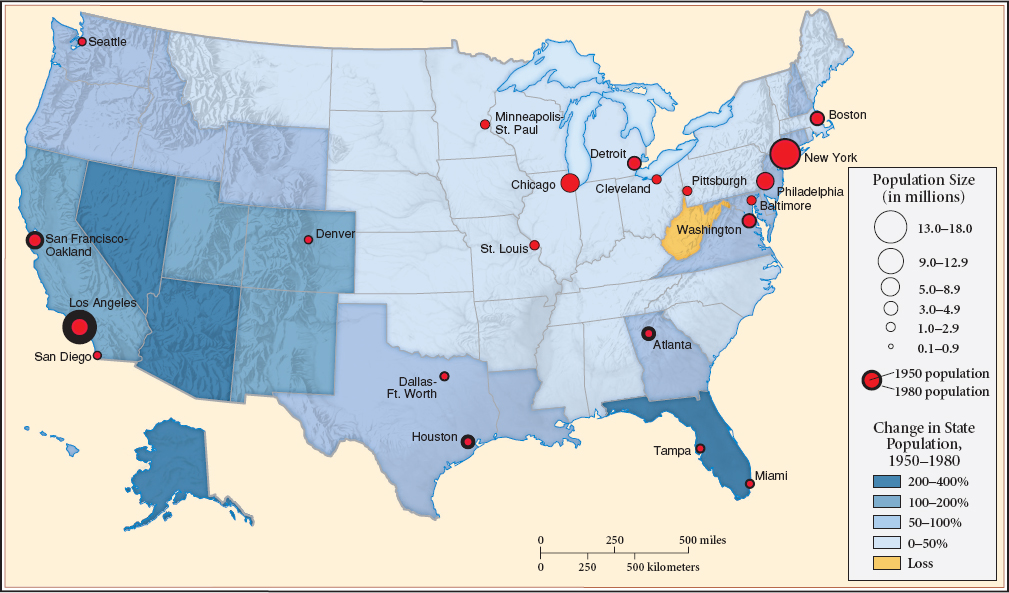
MAP 26.2 Shifting Population Patterns, 1950–1980
This map shows the two major, somewhat overlapping, patterns of population movement between 1950 and 1980. Most striking is the rapid growth of the Sunbelt states. All the states experiencing increases of over 100 percent in that period are in the Southwest, plus Florida. The second pattern involves the growth of metropolitan areas, defined as a central city or urban area and its suburbs. The central cities were themselves mostly not growing, however. The metropolitan growth shown in this MAP was accounted for by the expanding suburbs. And because Sunbelt growth was primarily suburban growth, that’s where we see the most rapid metropolitan growth, with Los Angeles the clear leader.