Concept 45.4: Biogeochemical Cycles Affect Global Climate
Concept 41.2 discussed how latitudinal and seasonal variations in the input of solar radiation drive global climate patterns. Earth’s climate is also influenced by the particular mix of gases that make up the atmosphere. As we saw in the opening story of this chapter, scientists have long known that some of these gases—particularly water vapor and carbon dioxide—absorb infrared radiation. Interactions of infrared-absorbing molecules with solar radiation have a profound effect on the radiation budget of the planet.
Earth’s surface is warm because of the atmosphere
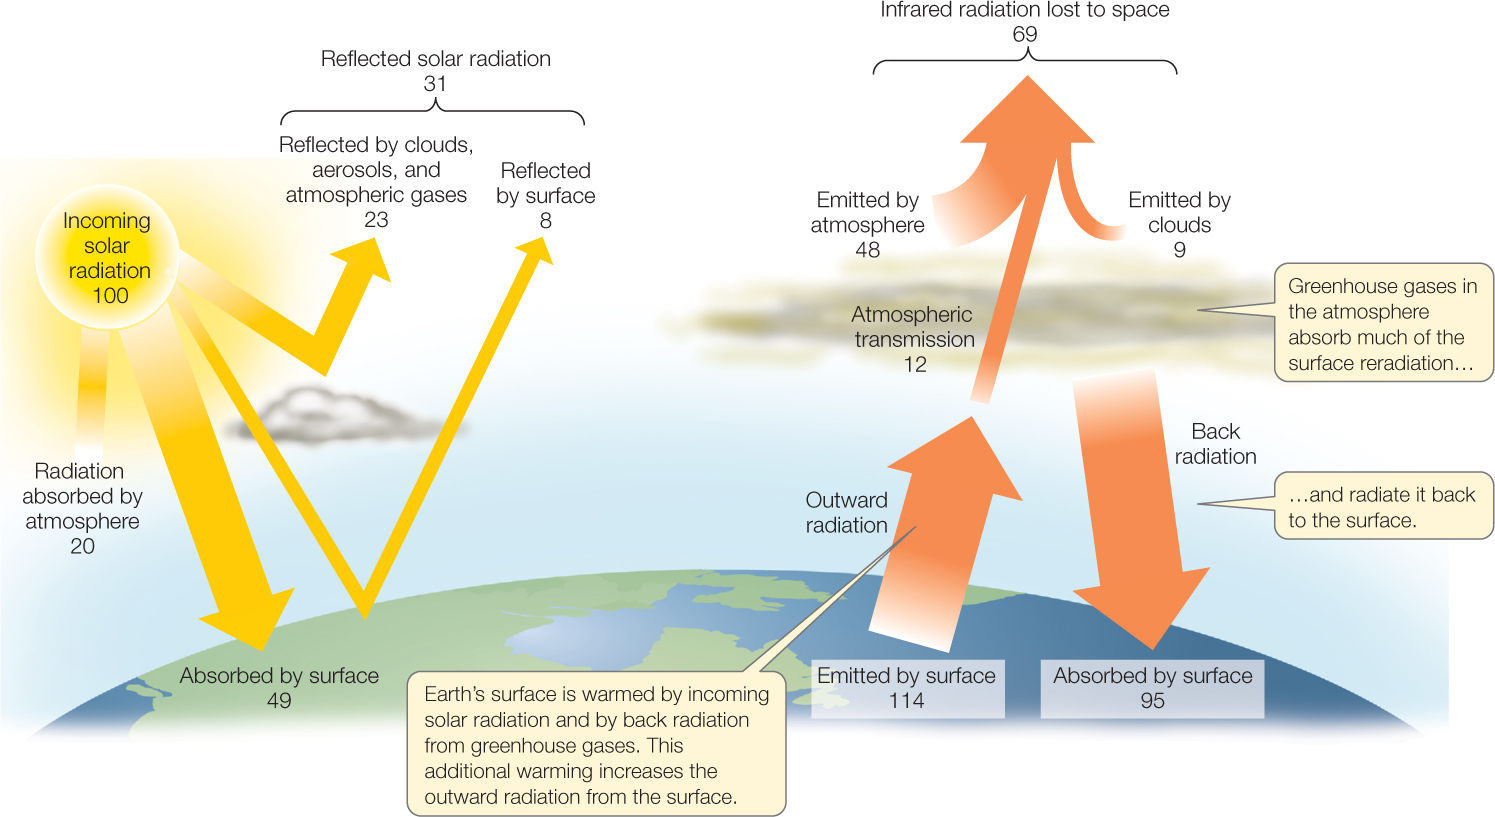
All objects that are warmer than absolute zero—our sun included—emit electromagnetic radiation (see Figure 6.16). The wavelengths emitted by an object depend on its temperature: hotter objects radiate at shorter, more energetic wavelengths. Because the surface of the sun is so hot—about 6,000°C—its radiation distribution peaks at wavelengths visible to the human eye. What happens to the incoming photons? Approximately 23 percent of them hit aerosols (tiny airborne particles and water droplets or ice crystals in clouds) and gas molecules in the atmosphere and are reflected back into space. Another 8 percent are reflected back into space when they hit Earth’s surface. About 20 percent are absorbed, rather than reflected, by gas molecules in the atmosphere. Finally, about 49 percent of incoming solar energy (168 watts per square meter, averaged across day and night, all seasons, and all locations) is absorbed at Earth’s surface (FIGURE 45.11).


Go to ANIMATED TUTORIAL 45.4 Earth’s Radiation Budget
PoL2e.com/at45.4
The warmed surface of Earth in turn reemits photons, but at much longer, less energetic, infrared wavelengths (wavelengths beyond the red end of the visible spectrum, which we perceive as heat). Some of this infrared radiation is absorbed by greenhouse gas molecules rather than escaping immediately into space. Those molecules reradiate infrared photons back to Earth’s surface, keeping the energy within the lower atmosphere. The additional warming of Earth caused by greenhouse gas molecules is called the greenhouse effect.
927
Water vapor, carbon dioxide, methane, nitrous oxide, and other molecules that absorb infrared radiation are referred to as greenhouse gases. The pools of these molecules in the atmosphere influence how much energy is retained in the lower atmosphere. Without its atmosphere, Earth’s average surface temperature would be a frigid −18°C, about 34°C colder than it is at present. The greenhouse effect influences any planet with an atmosphere, but its magnitude depends on the amounts and types of materials in the atmosphere. Mars’s thin atmosphere warms its surface by only 3°C, whereas the thick atmosphere of Venus warms that planet’s surface by a whopping 468°C.
Recent increases in greenhouse gases are warming Earth’s surface
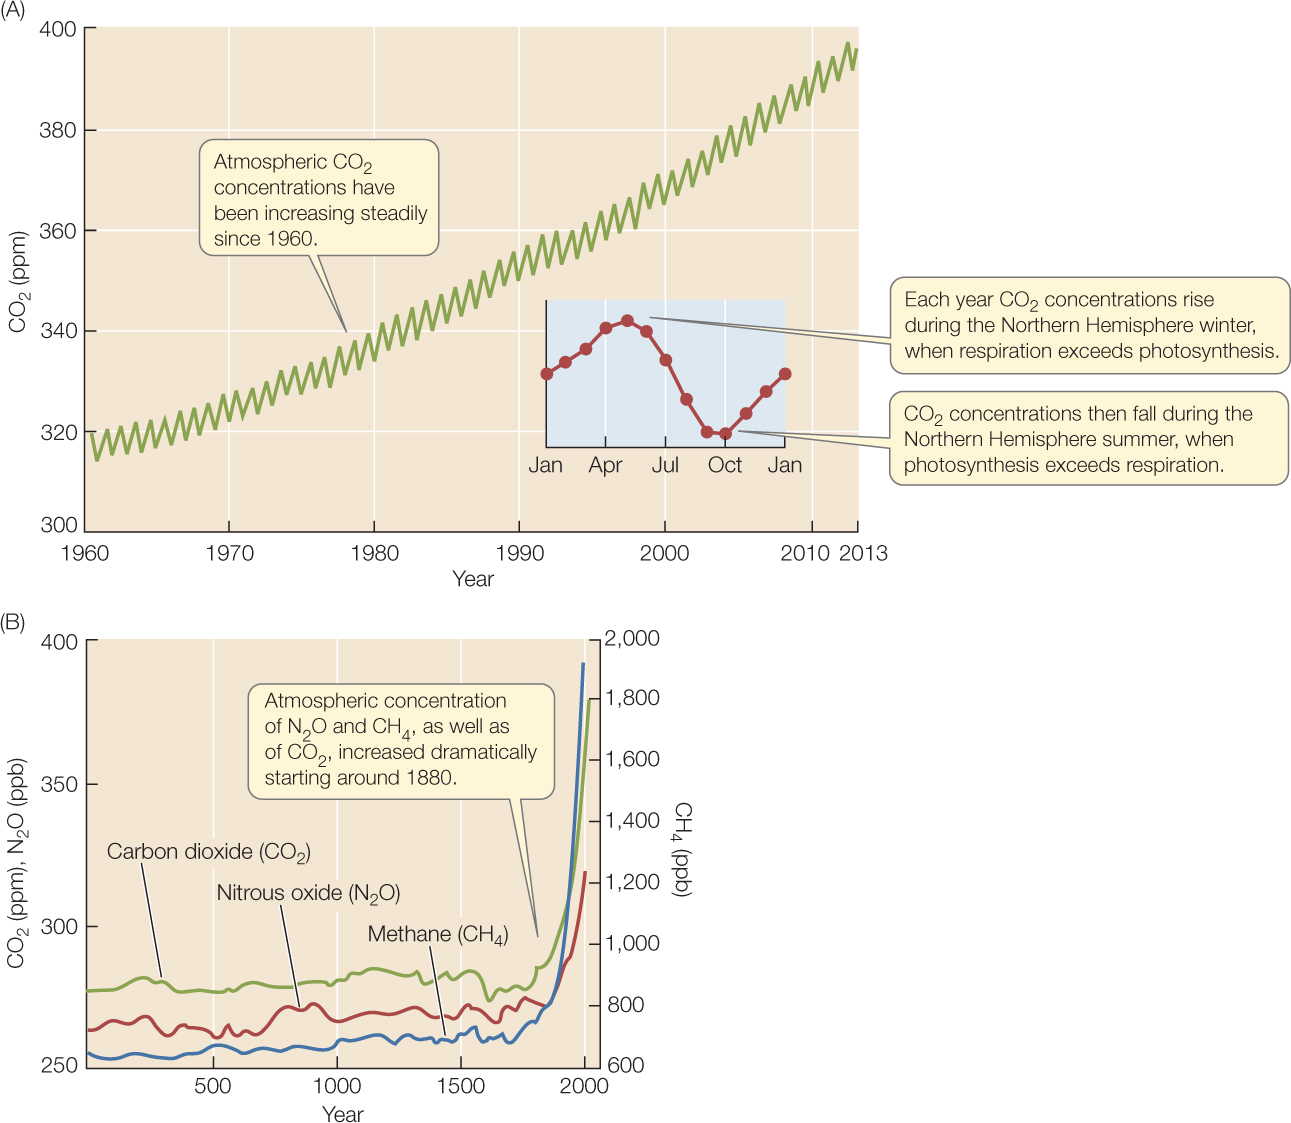
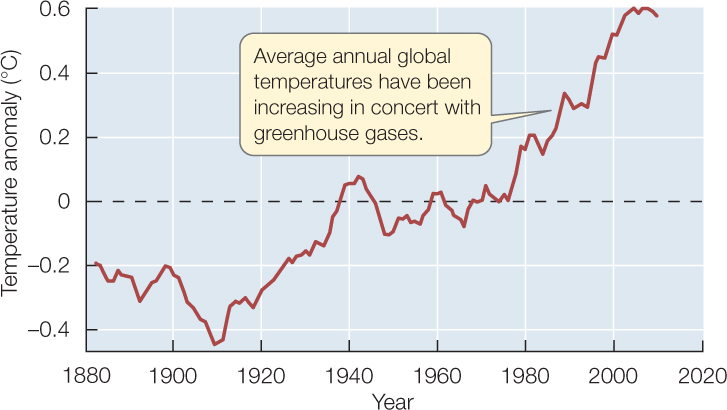
Improved methods for measuring the content of air samples accurately—such as Dave Keeling’s precise methods for measuring CO2—show us that the composition of the atmosphere is changing. The measurements initiated by Keeling reveal a steady increase in atmospheric CO2 over the last half century (FIGURE 45.12A). Analyses of air trapped in glacial ice demonstrate that CO2 and other greenhouse gases have been increasing even longer—since about 1880 (FIGURE 45.12B). Average annual global temperatures have followed suit (FIGURE 45.13).


Go to MEDIA CLIP 45.2 Time-Lapse of Global CO2 Emissions
PoL2e.com/mc45.2

This global warming is affecting patterns of climate worldwide. A warmer Earth means not only hotter air temperatures, but also more intense fluxes of water, with greater overall evaporation and precipitation. Hadley cells (see Concept 41.2) are expected to expand poleward because warmer tropical air will rise higher in the atmosphere and expand farther toward the poles before sinking. This expansion should cause precipitation to increase near the equator and at high latitudes and to decrease at middle latitudes. Global warming is uneven across Earth’s surface—for instance, the tropical Pacific and western Indian Oceans are warming more than other waters, and high latitudes are warming faster than low latitudes. As a result, changes in precipitation will be season- and region-specific, but in general, wet regions are expected to get wetter and dry regions drier. Precipitation trends over the twentieth century appear to support these expectations (FIGURE 45.14). Global warming is also predicted to increase storm intensity and weather variability. Recent analyses indicate that hurricane numbers have not increased, but strong hurricanes (category 4 and 5) and “megastorms” such as 2012’s Sandy have become more frequent since the 1970s.

928
Human activities are contributing to changes in Earth’s radiation budget
As we saw in Concept 45.3, human activities are affecting Earth’s biogeochemical cycles. Fossil fuel burning, cement manufacture, and forest clearing are adding CO2 to the atmosphere; expanded livestock production, water impoundment, and wetland crop cultivation are adding CH4 and N2O through anaerobic microbial metabolism. Other human activities are also influencing Earth’s radiation budget. Expansion of livestock grazing, agriculture, and offroad vehicle traffic in arid regions is increasing airborne dust. Dust and dark-colored soot particles (“black carbon”) from fossil fuel burning that are depositied on snow and ice increase absorption of incoming solar energy. The result is faster melting of persistent ice fields such as the Greenland ice sheet and Arctic sea ice, as well as advanced timing of spring snowmelt in temperate regions.
Other human activities have the potential to counteract these effects. Increasing amounts of aerosols in the atmosphere and land clearing, for example, increase the amount of solar radiation that is reflected. When climate scientists incorporate all of these effects into quantitative computer models of Earth’s climate, however, they conclude that human activities are contributing significantly to global warming and all the aspects of climate change that go with it (see Apply the Concept, p. 930). Now that we have seen how human activities are changing Earth’s radiation budget and climate, we can consider how ecological systems are responding.
CHECKpoint CONCEPT 45.4
- What factors caused the dramatic increases in carbon dioxide and methane in the atmosphere that became apparent by the late 1800s? (See Figure 45.12B. Hint: See also Figure 42.9.)
- Is the greenhouse effect something that occurs without humans, or is it caused by humans?
- Why is global warming linked to a greater intensity of storms? (Hint: Consider Concept 41.2.)
929