18.1 HEREDITY AND ENVIRONMENT
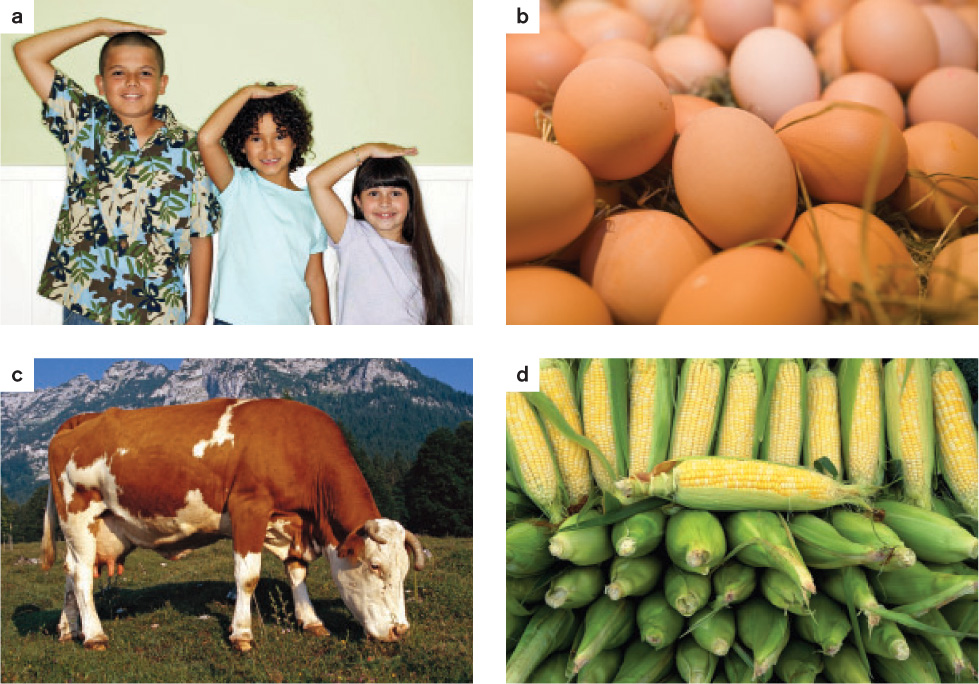
Complex traits are important not only in humans, but also in agricultural plants and animals. We will examine human height in some detail because it has been widely studied, but equally well known complex traits are number of eggs laid by hens, milk production in dairy cows, and yield per acre of grain (Fig. 18.1).
Many common human diseases, including high blood pressure, obesity, diabetes, and depression, are complex traits (Fig. 18.2). High blood pressure, for example, affects about one-third of the U.S. population, and obesity another third. Type 2 diabetes affects around 8% of the U.S. population, and an estimated 15% will suffer at least one episode of severe depression in the course of a lifetime. Taken together, about 200 million Americans—two-thirds of the entire population—suffer from one or more of these common disorders. None of these traits shows single-gene Mendelian inheritance.
In many complex traits, the phenotype of an individual is determined by measurement: Human height is measured in inches, milk yield by the gallon, grain yield by the bushel, egg production by the number of eggs, blood pressure by millimeters of mercury, and blood sugar by millimoles per liter. Because the phenotype of complex traits such as these is measured along a continuum with only small intervals between similar individuals, complex traits like these are often called quantitative traits. By contrast, single-gene traits often appear in one of two or more different phenotypes, such as round versus wrinkled seeds, or green versus yellow seeds.

18.1.1 Complex traits are affected by the environment.
Expression of complex traits is notoriously susceptible to lifestyle choices and other environmental factors. Inadequate nutrition is linked to slow growth rate and short stature in adults. Salt intake is associated with an increased likelihood of high blood pressure and is therefore an environmental risk factor for this common disorder. An environmental risk factor is a characteristic in a person’s surroundings that increases the likelihood of developing a particular disease. A junk-food diet high in fat and carbohydrates is an environmental risk factor for obesity and diabetes.
Environmental effects are also important in agriculture. Farmers are well aware that adequate nutrition is essential to normal growth of chicks, lambs, piglets, and calves, and that continued high-quality feed is necessary for high egg production and milk yield when the animals reach adulthood. In crop plants like grains, adequate soil moisture and nutrients are necessary for sustained high yields.
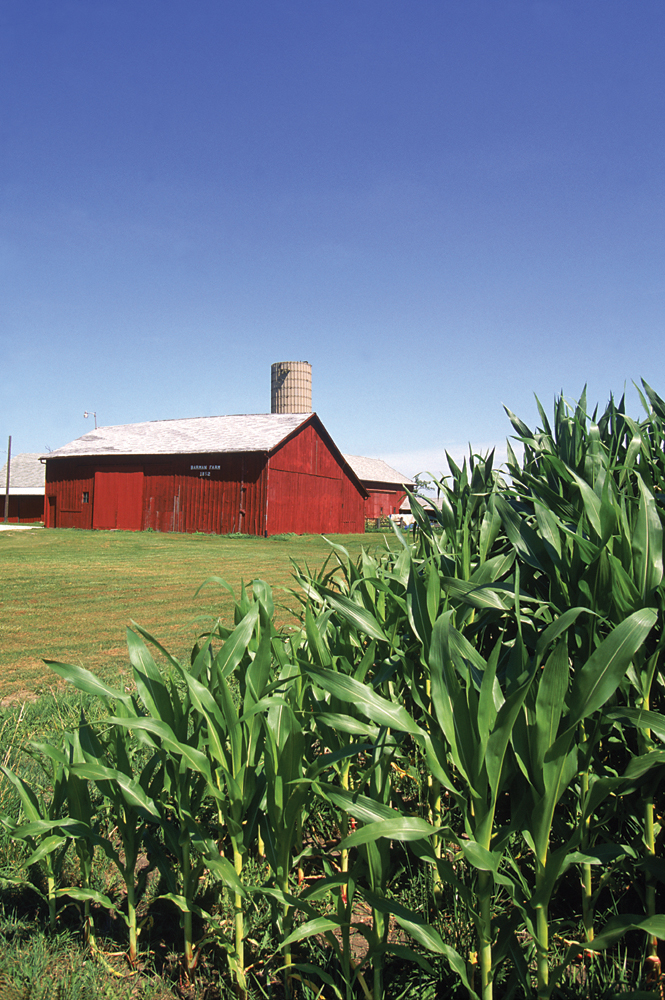
Environmental factors not only affect the average phenotype for complex traits, but they also affect the variation in phenotype from one individual to the next. For example, most fields of corn you see planted along the roadside come from seeds that are genetically identical to one another, yet there is phenotypic variation in complex traits like plant height (Fig. 18.3). Because the plants are genetically identical, the differences in phenotype result from differences in the environment. Some parts of the field may receive more sunlight than others, and some parts may have better water drainage. No matter how uniform an environment may seem, there are always minor differences from one area to the next, and these differences can result in variation in complex traits.
Environmental effects on complex traits in animals are evident in true-breeding, totally homozygous strains produced by many generations of brother–sister matings, like those used by Mendel in his experiments with pea plants. Such true-breeding, homozygous strains are called inbred lines, and they are often used for research. Even though all animals in any inbred line are genetically identical, and are caged in the same facility and fed the same food, there is variation from one animal to the next. In one study of cholesterol levels in an inbred line of mice, for example, average serum cholesterol was 120 mg/dl (milligrams per deciliter), but the range was 60–180 mg/dl. Because the mice are genetically identical, the variation in serum cholesterol resulted from variation in the environment.
18.1.2 Complex traits are affected by multiple genes.
Most complex traits are affected by many genes, in contrast to Mendel’s traits, which are primarily affected only by one. Therefore, in complex traits the familiar phenotypic ratios such as 3:1 that Mendel observed when he crossed two true-breeding strains with contrasting characters are not observed. For complex traits, the effects of individual genes are obscured by variation in phenotype that is due to multiple genes affecting the trait and also due to the environment. The number of genes affecting complex traits is usually so large that different genotypes can have very similar phenotypes, which also makes it difficult to see the effects of individual genes on a trait.
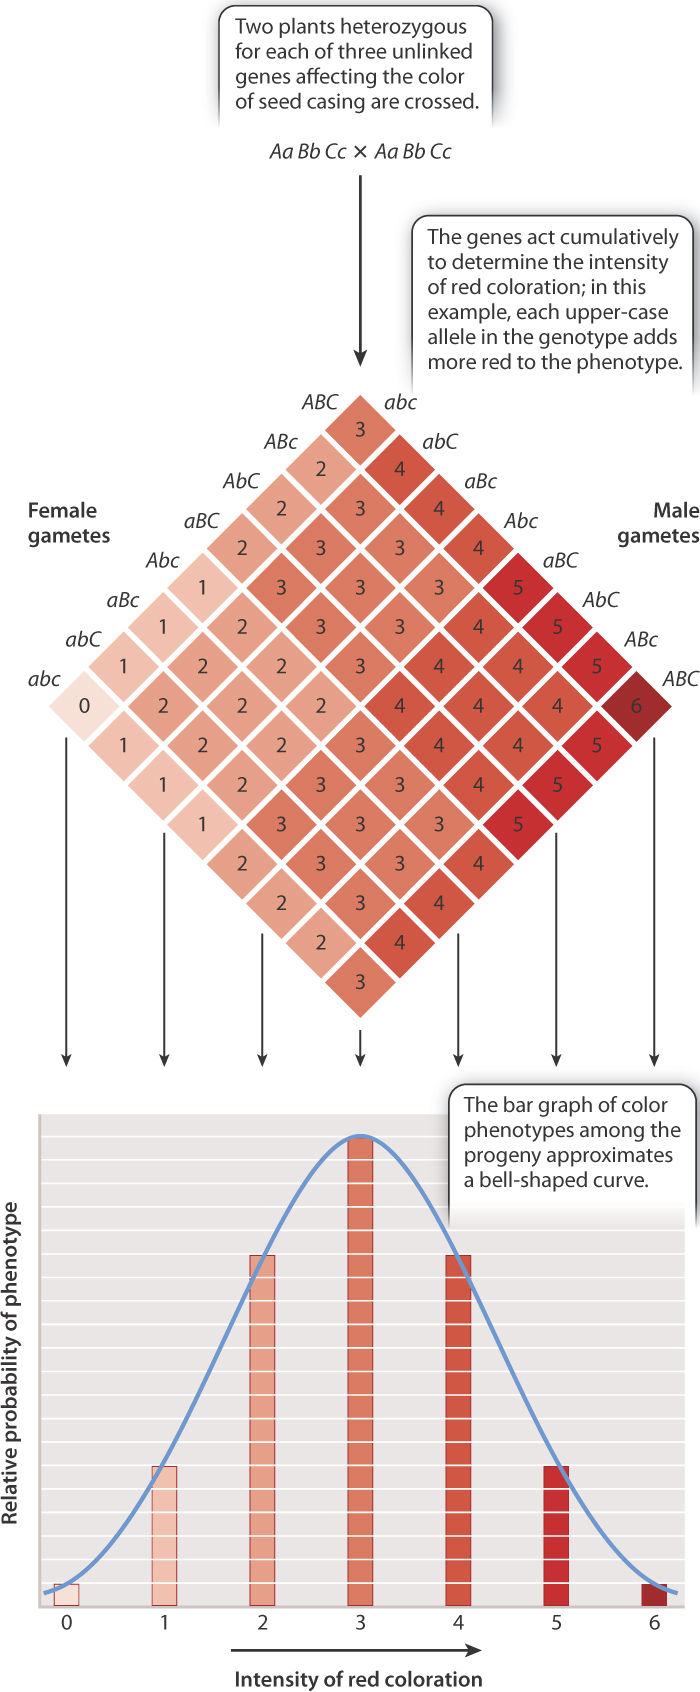
In a few traits, however, the effects of the environment are minor and the number of genes is small, and in these cases the genetic basis of the trait can be analyzed. A classic example, studied by Herman Nilsson-Ehle about a century ago, concerns the color of seed casing in wheat (the “seed color”), which ranges from nearly white to dark red (Fig. 18.4). His experiment demonstrated that complex traits are subject to the same laws that Mendel worked out for single-gene traits, but that the inheritance patterns are more difficult to see because of the number of genes involved.
In studying seed color in true-breeding varieties and their first-generation and second-generation hybrids, Nilsson-Ehle realized that the relative frequencies of different shades of red color could be explained by the effects of three genes that undergo independent assortment, as illustrated by the Punnett square shown in Fig. 18.4. Each of the genes has two alleles, designated by combinations of upper-case and lower-case letters. In the development of seed color, each upper-case allele in a genotype intensifies the red coloration in an additive fashion. Altogether there are seven possible phenotypes, ranging from a phenotype of 0 (nearly colorless, genotype aa bb cc) to 6 (dark red, genotype AA BB CC).
In the cross shown at the top of Fig. 18.4, the parental genotypes are both Aa Bb Cc, and so they each have a phenotype of 3, an intermediate seed color on the 0-to-6 color scale. If the three genes show independent assortment (Chapter 16), then the distribution of phenotypes expected in progeny from the cross Aa Bb Cc × Aa Bb Cc is as shown in the Punnett square, in which the numbers indicate the number of upper-case alleles in each class of offspring. The bar graph below the Punnett square shows the distribution of the seed-color phenotypes and the probability of each of the possible phenotypes, which is approximated reasonably well by the bell-shaped curve known as the normal distribution. The phenotypes of many complex traits, including human height, conform to the normal distribution. Nelson-Ehle’s results conformed to a normal distribution, consistent with the hypothesis of three unlinked genes each with two alleles influencing seed color in wheat.
When differences in phenotype due to the environment can be ignored, the genetic variation affecting complex traits can be detected more easily. And when studying inbred lines, differences in phenotype due to genotype can be ignored because all individuals have the same genotype, and the effects of environment can be observed. In most cases, however, genetic variation among individuals and environmental variation among individuals are both present, and it is difficult to quantify how much variation in phenotype is due to genetics and how much due to environment.
It’s important to point out that complex traits are not really more “complex” than any other biological trait. The term is used merely to imply that both genetic factors and environmental factors contribute to variation in phenotype among individuals. As there are environmental factors that affect complex traits such as height, so there are genetic factors that affect height (as we discuss below). Similarly, just as an environmental risk factor increases the likelihood of a common disease, so does a genetic risk factor predispose an individual to the condition. For example, the human gene ApoE encodes a protein that helps transport fat and cholesterol. Certain alleles of ApoE are associated with high levels of cholesterol, and one particular allele is a genetic risk factor for Alzheimer’s disease, the most common serious form of age-related loss of cognitive ability.
18.1.3 The relative importance of genes and environment can be determined by differences among individuals.
For any one individual, it is impossible to specify the relative roles of genes and environment in the expression of a complex trait. For example, in an individual 66 inches tall, it would be meaningless to attribute 33 inches of height to parentage (genes) and 33 inches of height to nutrition (environment). This kind of partitioning makes no sense because genes and environment act together so intimately in each individual that their effects are inseparable. To attempt to separate them for any individual would be like asking to what extent it is breathing or oxygen that keeps us alive. Both are important, and both must take place together if we are to stay alive.
It is nevertheless possible to separate genes and environment in regard to their effects on the differences, or variation, among individuals within a particular population. For some traits, the variation seen among individuals is due largely if not exclusively to differences in the environment. For other traits, the variation is due mainly to genetic differences. In the case of human height, roughly 80% of the variation among individuals of the same sex is due to genetic differences, and the remaining 20% to differences in their environment, primarily differences in nutrition during their years of growth.
18.1.4 Genetic and environmental effects can interact in unpredictable ways.
One of the features of complex traits is that genetic and environmental effects may interact, often in unpredictable ways. Consider the example shown in Fig. 18.5. In this experiment, two strains of corn were each grown in a series of soils in which the amount of nitrogen had been enriched by the growth of legumes. The yield of strain 1 varies little across these different environments. The yield of strain 2, however, increases dramatically with soil nitrogen. Each of the lines is known as a norm of reaction, which for any genotype graphically depicts how the environment (shown on the x-axis) affects phenotype (shown on the y-axis) across a range of environments. Note that in one case in Fig. 18.5, the environment has little to no effect on the phenotype (the norm of reaction is nearly flat), but in the other it has a very noticeable effect. Therefore, it is impossible to predict the phenotype of a given genotype without knowing what the environmental conditions are and how the phenotype changes in response to variation in the environment.
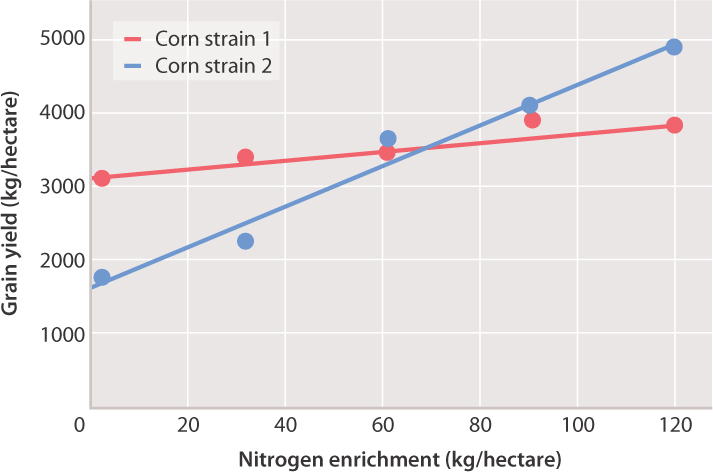
Such variation in the effects of the environment on different genotypes is known as genotype-by-environment interaction. This type of interaction is important because it implies that the effect of a genotype cannot be specified without knowing the environment, and the other way around. A further implication is that there may be no genotype that is the “best” across a broad range of environments, and likewise no environment that is “best” for all genotypes. For complex traits, phenotype depends on both genotype and environment. For the strains of corn in Fig. 18.5, for example, which strain is “better” depends on the soil nitrogen. With little nitrogen enrichment, strain 1 is better; at intermediate values, both strains yield about the same; and with high nitrogen enrichment, strain 2 is better. In this case, knowing the norms of reaction, and recognizing the magnitude and direction of genotype-by-environment interaction, allows each farmer to use the strains likely to perform best under the available conditions of cultivation.
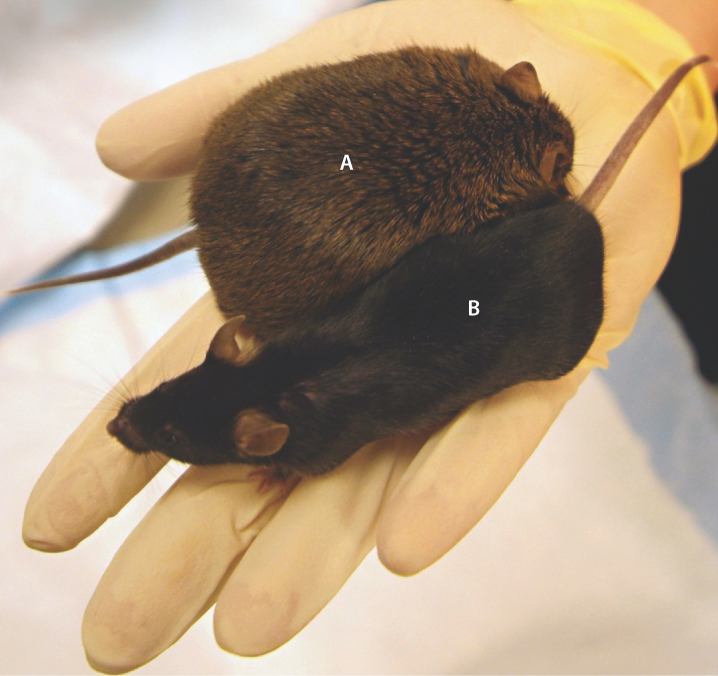
Genotype-by-environment interaction implies that the interplay between genes and the environment is difficult to predict. An example of genotype-by-environment interaction affecting obesity is shown in Fig. 18.6. The animals shown are adults of two inbred lines of mice. When fed a normal diet, both inbred lines grow to be about the same size. When fed a high-fat diet, however, the inbred line A becomes obese, whereas inbred line B does not. Hence, it is not genotype alone that causes obesity in line A because with a normal diet, line A does not become obese. Nor is it a high-fat diet alone that causes obesity because the high-fat diet does not cause obesity in line B. Rather, the obesity in line A results from a genotype-by-environment interaction (which in this case is a genotype-by-diet interaction).