CHAPTER 25 INTRODUCTION
CORE CONCEPTS
25.1 Photosynthesis and respiration are the key biochemical pathways for the biological, or short-term, carbon cycle.
25.2 Physical processes govern the long-term carbon cycle.
25.3 The carbon cycle can help us understand ecological interactions and the evolution of biological diversity.
In 1958, American chemist Charles Keeling began a novel program to monitor the atmosphere. At the time he began his study, scientists had only a vague notion of how carbon dioxide (CO2) behaves in air. Many thought that CO2 might vary unpredictably from time to time, and from place to place. Keeling decided to find out if in fact it did. From five towers set high on Mauna Loa in Hawaii, 3400 m above sea level, he sampled the atmosphere every hour and measured its composition with an infrared gas analyzer. Within the first few years of his project, a pattern of seasonal oscillation became apparent: CO2 concentration in the air reached its annual high point in spring and then declined by about six parts per million (ppm, by volume) to a minimum in early fall (Fig. 25.1). Such regular variation was unexpected: What could be causing it?
Perhaps the pattern was local. Airplane traffic to Hawaii peaked in winter, and maybe that was affecting the air around Mauna Loa. As measurements continued through a number of years, however, the pattern persisted, even as trends in air traffic changed. Moreover, monitoring stations in many other parts of the globe gave similar results. Knowing that the Mauna Loa measurements are representative of the atmosphere as a whole allows us to appreciate what an annual variation of 6 ppm really means. With calendar-like regularity, approximately 47 billion metric tons of CO2 were entering and leaving the atmosphere annually—that’s 13 billion metric tons of the element carbon (the rest of the mass is oxygen). To explain such a pattern, we must consider processes that affect the planet as a whole.
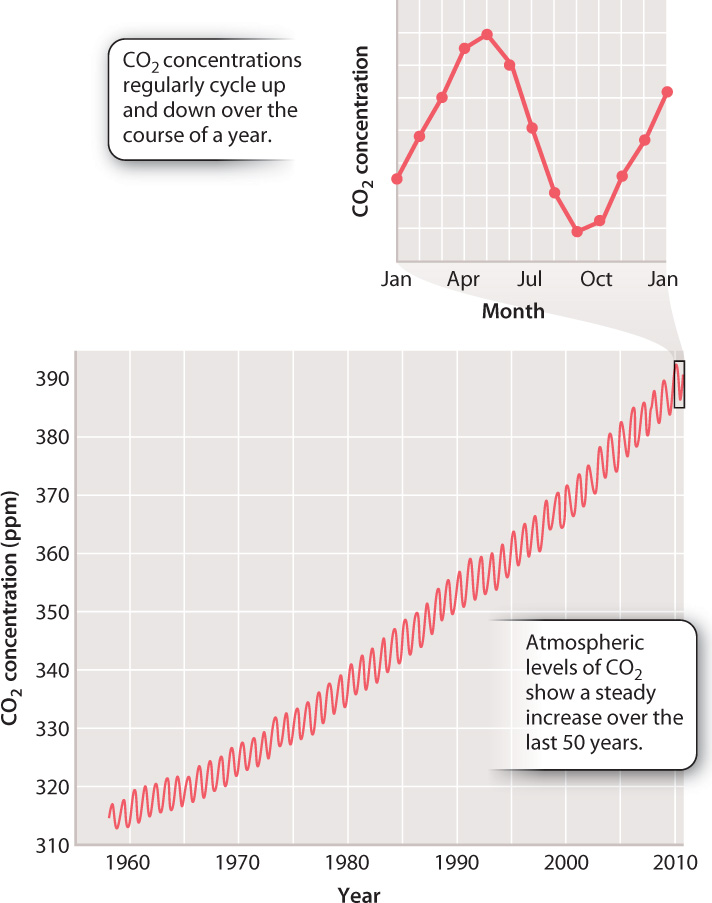
A second pattern is evident in Fig. 25.1. Summertime removal of CO2 from the atmosphere does not quite balance winter increase, with the result that the amount of CO2 in the atmosphere on any given date is greater than it was a year earlier. Atmospheric CO2 levels have therefore increased steadily through the period of monitoring. For example, mean annual CO2 levels, about 315 ppm in 1958, reached 397 ppm by May 2012. This is an increase of more than 25%, and there is no indication that the rise will slow or stop any time soon. What causes this increase? What might be its consequences?
Recognizing the processes reflected in the Keeling curve provides a crucial first step toward understanding the carbon cycle, the intricately linked network of biological and physical processes that shuttles carbon among rocks, soil, oceans, air, and organisms. The carbon cycle, in turn, provides a glimpse of the interactions that underpin ecology and promote biological diversity. It focuses our attention on the ways that physical and biological processes interact to determine the properties of environments. And it provides a basis for assessing the role that humans play in our environmental present and future.