25.1 THE SHORT-TERM CARBON CYCLE
What causes atmospheric carbon dioxide to vary through the year and over a timescale of decades? To answer this question, we need to ask what processes introduce CO2 into the atmosphere and what processes remove it. CO2 is added to the atmosphere by (1) geologic inputs, mainly from volcanoes and mid-ocean ridges; (2) biological inputs, especially respiration; and (3) human activities, including deforestation and the burning of fossil fuels. Processes that remove CO2 from the atmosphere include (1) geologic removal, especially by the chemical weathering of rocks, and (2) biological removal, mainly through photosynthesis. As we will see, geologic processes play key roles in the carbon cycle on timescales of centuries and longer. Only biology can account for the annual rhythm of the Keeling curve.
25.1.1 Photosynthesis and respiration are key processes in short-term carbon cycling.
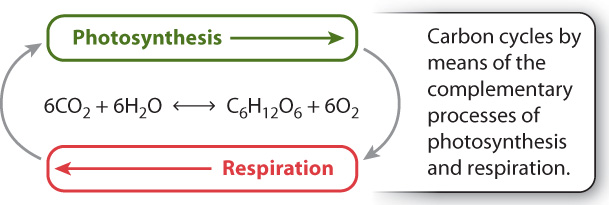
To grow, all organisms require both carbon and energy. As we saw in Chapter 8, photosynthetic organisms convert energy from the sun into ATP, which they use to reduce CO2 to sugar. As photosynthesis pulls CO2 out of the atmosphere (or water, for aquatic organisms), the carbon is transferred to carbohydrates, and oxygen is given off as a by-product. The summary chemical reaction is shown here:
6CO2 + 6H2O → C6H12O6 + 6O2
It is estimated that photosynthetic organisms remove 190 billion metric tons of carbon (in nearly 700 billion metric tons of CO2) from the atmosphere each year, about 60% by land plants and the rest by phytoplankton and seaweeds in the oceans. This annual photosynthetic removal of CO2 equals about 25% of the total CO2 in the atmosphere. In the absence of processes that restore CO2 to the atmosphere, high rates of photosynthesis would use up the atmospheric reservoir of carbon dioxide in just a few years. But the Keeling curve tells us that atmospheric CO2 is not decreasing rapidly—it is rising. Moreover, the geologic record indicates that photosynthesis has fueled ecosystems for billions of years without causing CO2 depletion.
What processes return CO2 to the atmosphere, balancing photosynthetic removal? In Chapter 7, we discussed aerobic respiration. Humans and many other organisms gain both the energy and carbon needed for growth from organic molecules (that is, by consuming food). As explained in Chapter 7, aerobic respiration uses oxygen to oxidize organic molecules to carbon dioxide, converting chemical energy in the organic compounds to ATP for use in cellular processes. Aerobic respiration can be summarized by this chemical equation:
C6H12O6 + 6O2 → 6CO2 + 6H2O
Plants respire, too, converting the chemical energy in carbohydrates into useful work. On the present-day Earth, the amount of CO2 returned annually to the atmosphere by aerobic respiration and related processes is about equal to the amount that plants and algae remove by photosynthesis. That is why photosynthesis does not deplete the CO2 in air.
As we discussed in Chapter 8, the equations for oxygenic photosynthesis and aerobic respiration mirror each other. Photosynthesis continually converts CO2 to organic molecules, using energy from the sun, and respiration harvests the chemical energy stored in organic molecules, releasing CO2 and water in the process. Photosynthesis and aerobic respiration are complementary metabolic pathways: Each uses the products of the other and generates a new supply of substrates for its complement. The result is a cycle (Fig. 25.2).
25.1.2 The regular oscillation of CO₂ reflects the seasonality of photosynthesis in the Northern Hemisphere.
Now that we have identified the major processes in the short-term carbon cycle, we can examine what makes atmospheric CO2 level oscillate seasonally. Except in a narrow band around the equator, photosynthesis is seasonal, with higher rates in the summer and lower rates in the winter. Respiration, in contrast, remains more or less constant through the year.
Even cursory examination shows that land on Earth is distributed asymmetrically, with more land—and hence more plants—in the Northern Hemisphere than in the Southern Hemisphere. For this reason, global atmospheric CO2 declines through the northern summer, when the ratio of photosynthesis to respiration is highest, and then increases through fall and winter, when the ratio is reversed. The result is the seasonal oscillation of atmospheric CO2 levels documented by Keeling.
25.1.3 Human activities play an important role in the modern carbon cycle.
Now let us ask about the second major pattern evident in the Keeling curve. Although CO2 levels oscillate on an annual basis, the overall pattern is one of sustained increase. During the 1960s, the observed increase was less than 1 ppm each year. In the first decade of the new millennium, it has been closer to 2 ppm. The current level of atmospheric CO2 is 25% higher than it was 50 years ago. Why has CO2 input into the atmosphere outstripped removal for the past half century? Should we consider this pattern unusual?
Answering the second question helps us to address the first. Conclusions about whether it is unusual for atmospheric CO2 to increase 25% in 50 years can be answered only if we can compare the Keeling curve to longer records of atmospheric CO2 levels. Before Keeling, no one systematically collected air samples. Fortunately, however, nature did it for us. When glacial ice forms in Antarctica and Greenland, it traps tiny bubbles of air. Each year, snowfall gives rise to a new layer of ice, and as layers accumulate through time their bubbles preserve a history of the atmosphere. Fig. 25.3 shows the amount of CO2 in air bubbles trapped in Antarctic ice that has accumulated over the past 1000 years. Ice samples show that CO2 levels actually began to increase slowly in the 1800s, the time of major transformations in mining, manufacturing, and transportation we call the Industrial Revolution. Before that, however, atmospheric CO2 levels had varied little since the Middle Ages, staying at 270–280 ppm for centuries on end. On a 1000-year timescale, then, big changes in CO2 abundance happened only once, over the last 200 years. Atmospheric CO2 inputs and outputs were approximately in balance until the Industrial Revolution.
FIG. 25.3How much CO₂ was in the atmosphere 1000 years ago?
BACKGROUND Direct measurements of the atmosphere show that CO2 has increased by 25% over the past 50 years. To know whether or not such a change is unusual, we need to know CO2 levels over a longer time interval.
OBSERVATION Scientists recognized that the snow that accumulates on glaciers to form new layers of ice is initially full of small spaces that are in contact with the air. Through time, as snow changes to ice, these spaces become sealed off from the surrounding environment and form bubbles, preserving a minute sample of air at the time of ice formation.
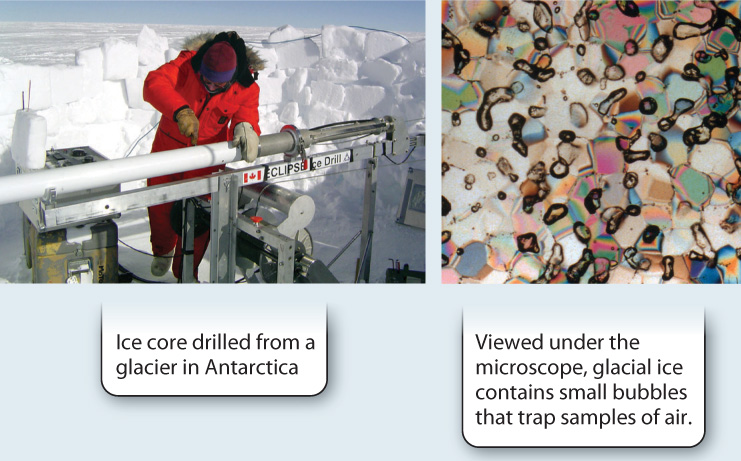
MEASUREMENTS Physical layering and chemical indicators that vary on an annual basis enabled scientists to assign ages to ice samples taken from cores drilled through the Law Dome, a large ice dome in Antarctica. The youngest ice samples overlap in age with the first part of the Keeling data, providing a check that air samples trapped in ice have CO2 concentrations similar to those in air measured directly over the same interval.
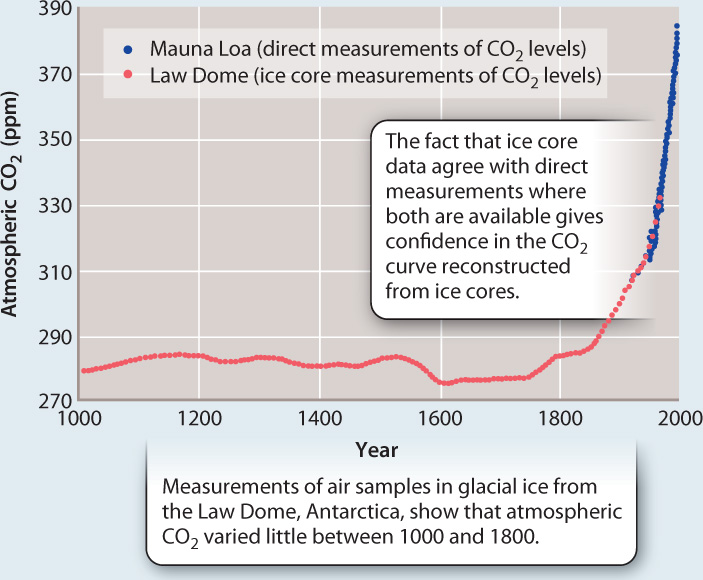
CONCLUSIONS Before the Industrial Revolution, atmospheric CO2 levels had varied little over 1000 years, generally falling between 270 and 280 ppm. From this, scientists have concluded that current changes in atmospheric CO2 are unusual on the timescale of the past millennium.
SOURCE Etheridge, D. M., L. P. Steele, R. L. Langenfelds, R. J. Francey, J.-M. Barnola, and V. I. Morgan. 1996. “Natural and Anthropogenic Changes in Atmospheric CO2 over the Last 1000 Years from Air in Antarctic Ice and Firn.” Journal of Geophysical Research 101: 4115–4128.
Fig. 25.3 shows that there is a correlation between the increasing CO2 content of the atmosphere and human activities. A correlation simply indicates that two events or processes occur together. Can we actually demonstrate that humans have played a role in recent atmospheric change? By itself, correlation does not establish causation, a relationship in which one event leads to another. We might propose instead that recent CO2 increase reflects natural processes and only matches the period of industrialization by coincidence.
We can test the hypothesis that human activities have contributed to the increases in atmospheric CO2 measured at Mauna Loa and in ice cores by making careful measurements of a chemical detail: the isotopic composition of atmospheric CO2.
Quick Check 1
How does the graph in Fig. 25.3 suggest that human activities have influenced carbon dioxide levels in the atmosphere? What might be a plausible alternative hypothesis?
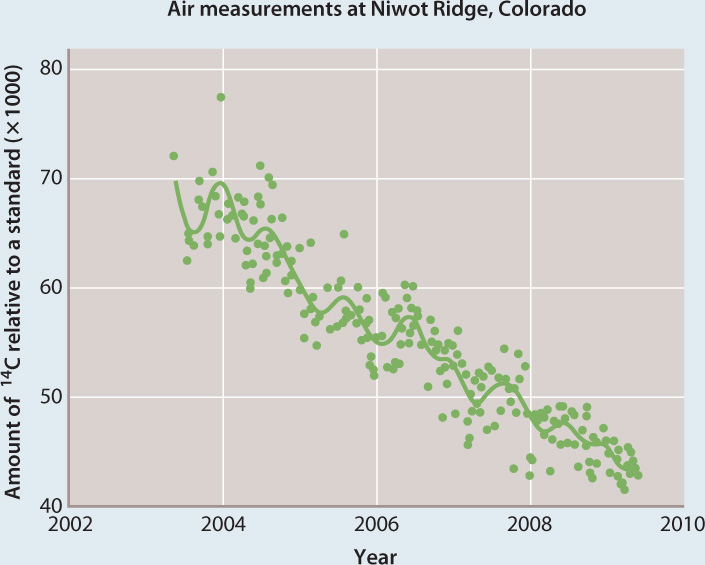
25.1.4 Carbon isotopes show that much of the CO₂ added to air over the past half century comes from burning fossil fuels.
In Chapter 2, we saw that many elements have several isotopes, atoms of the element that vary in atomic mass because they have different numbers of neutrons. Carbon has three isotopes: 12C (with six neutrons, about 99% of all carbon atoms); 13C (with seven neutrons, most of the remaining 1%); and the rare 14C (with eight neutrons, about one part per trillion of atmospheric carbon). Beginning more than 40 years ago, the Austrian-born chemist Hans Suess measured the relative abundances of the three isotopes of carbon in atmospheric CO2, a program that continues today. He observed that the proportion of 13C in atmospheric CO2 has declined as the total amount of CO2 has increased (Fig. 25.4). This subtle change in isotopic composition occurred because the carbon dioxide being added to the atmosphere has less 13C than the CO2 already in the air.
FIG. 25.4What is the major source of the CO₂ that has accumulated in Earth’s atmosphere over the past two centuries?
BACKGROUND Chemical analyses show that CO2 levels in the current atmosphere are about 40% higher than they were at the time of the American Revolution. This rise coincides with major advances in manufacturing and transportation, which are driven by the burning of fossil fuels.
HYPOTHESIS The burning of fossil fuels, central to the emergence of modern industrial societies, has been the principal source of the measured increase of CO2 in the atmosphere.
EXPERIMENT AND RESULTS Hans Suess measured the abundance of the two stable isotopes of carbon, 13C and 12C, in air samples and demonstrated that the ratio of 13C to 12C in atmospheric CO2 has decreased over the second half of the twentieth century. Additional measurements of coral skeletons and wood show that the ratio of 13C to 12C in air has been decreasing over the entire period during which atmospheric CO2 levels have been increasing.
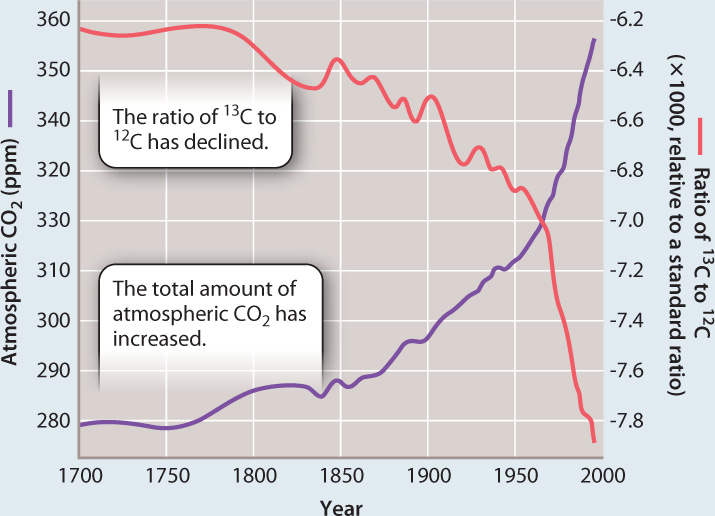
DISCUSSION The ratio of 13C to 12C in CO2 added to the atmosphere over the past 200 years is lower than that in CO2 already in the air. The 13C:12C ratio of CO2 emitted by volcanoes is too high to account for the data, as is that of CO2 released from the oceans. In contrast, organic matter formed by photosynthesis has just the right isotopic composition to account for the isotopic measurements.
FOLLOW-UP WORK Further studies, using 14C, the third, unstable isotope of C, also show a strong decrease in the proportional abundance of 14C in atmospheric CO2 over time. While the burning of vegetation to clear land for agriculture results in CO2 with the right ratio of 13C to 12C, modern vegetation has far too much 14C to account for observed changes in the 14C of air. Only fossil fuels have the right ratios of all three carbon isotopes—12C, 13C, and 14C—to account for the pattern of isotopic change in atmospheric CO2 measured by Suess and others. In fact, 14C data from the high Rocky Mountains indicate that if fossil fuels were the principal source of added CO2, carbon dioxide levels should have increased by a little less than 2 ppm per year between 2004 and 2008—which is very close to the increase actually measured.
CONCLUSION Fossil fuel burning by industrialized societies has been, and continues to be, a principal source of carbon dioxide build-up in Earth’s atmosphere.
SOURCES Revelle, R., and H. E. Suess. 1957. “Carbon dioxide exchange between atmosphere and ocean and the question of an increase of atmospheric CO2 during the past decades.” Tellus 9:18–27; Turnbull, J. C., S. J. Lehman, J. B. Miller, R. J. Sparks, J. R. Southon, P. P. Tans. 2007. “A new high precision 14CO2 time series for North American continental air.” Journal of Geophysical Research-Atmospheres 112, no. D11. Article Number: D11310. doi: 10.1029/2006JD008184.
How does this result influence the hypotheses we developed to account for increasing atmospheric CO2 levels? The various candidate sources of increasing carbon dioxide have different proportions of 13C and 12C. Potential CO2 contributors such as volcanic gases and inorganic carbon dissolved in the oceans do not have the right isotopic composition to explain the observed change. Organic carbon in living organisms and in soil has the right 13C composition. Therefore, processes that cause a net conversion of organic matter to carbon dioxide must be adding CO2 to the atmosphere.
Here’s where the other isotope of carbon, 14C, comes in. Measurements also show that the sources of added carbon dioxide are depleted in 14C relative to CO2 already in the air. Modern organic matter contains too much 14C to account for the observed pattern, but ancient organic matter—the coal, petroleum, and natural gas burned as fossil fuels—is isotopically just right. Chemical analyses, therefore, support the hypothesis that human activities cycle carbon in amounts high enough to affect the chemical composition of the atmosphere.
That atmospheric CO2 is increasing is not a hypothesis; it is a measurement. That the burning of fossil fuels plays an important role in this increase is also unambiguously documented by chemical analyses. Current debate focuses not on these observations, but instead on the more difficult problem of understanding how increasing CO2 may affect climate. We discuss this debate in Chapter 48. For now, however, we can use some relevant numbers to reveal another important aspect of the carbon cycle.
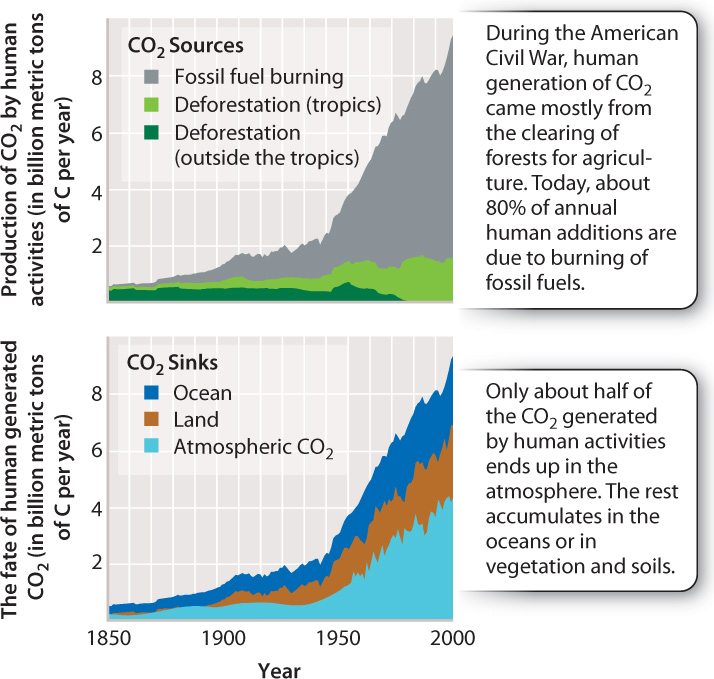
As shown in the top graph in Fig. 25.5, humans add about 8 billion metric tons of carbon to the atmosphere each year, nearly all of it as carbon dioxide. Much of this material comes from power plants, airplanes, ships, and automobiles, which oxidize ancient organic matter to CO2 on a grand scale. Further important inputs come from the conversion of forests to agriculture or pastureland. Clearing and burning forest trees also oxidizes organic carbon to CO2.
Interestingly, if we compare our best estimates of nonrespiratory human CO2 generation since 1958 with the measured increase in atmospheric CO2, we find that about half of the CO2 released by human activities did not end up in the air. Where did it go? This has been a major question for years, and it now appears that much of the “missing carbon” has been stored as inorganic carbon in the form of CO2, bicarbonate (HCO3−), and carbonate (CO32−) ions dissolved in the oceans. The bottom graph in Fig. 25.5 shows an estimate of the various places where human-produced CO2 ends up. These observations indicate that Earth’s carbon cycle is more complicated than a simple exchange of carbon between photosynthesis and respiration. There are additional storehouses of carbon and additional processes that move carbon from one store to another, topics we discuss next.