25.2 THE LONG-TERM CARBON CYCLE
Up to this point, we have considered only the short-term carbon cycle: exchanges over days, years, and decades driven by the biological processes of photosynthesis and respiration, and altered in recent times by human activities. Geologic evidence, however, tells us that on longer timescales, carbon dioxide levels in air have changed dramatically. These longer-term changes mean that we must consider additional contributions to the carbon cycle: physical processes, including volcanism and climate change. Indeed, the complete carbon cycle links Earth’s physical and biological processes, providing a foundation for understanding the interconnected histories of life and environment through our planet’s long history.
25.2.1 Reservoirs and fluxes are key in long-term carbon cycling.
To understand how biological and physical processes interact to govern carbon dioxide levels in the air, we must first look at how carbon is distributed among its various reservoirs, the places where carbon resides in the Earth. Reservoirs of carbon include organisms, the atmosphere, soil, the oceans, and sedimentary rocks, as shown in the purple boxes in Fig. 25.6. How much carbon is stored in each of these reservoirs?
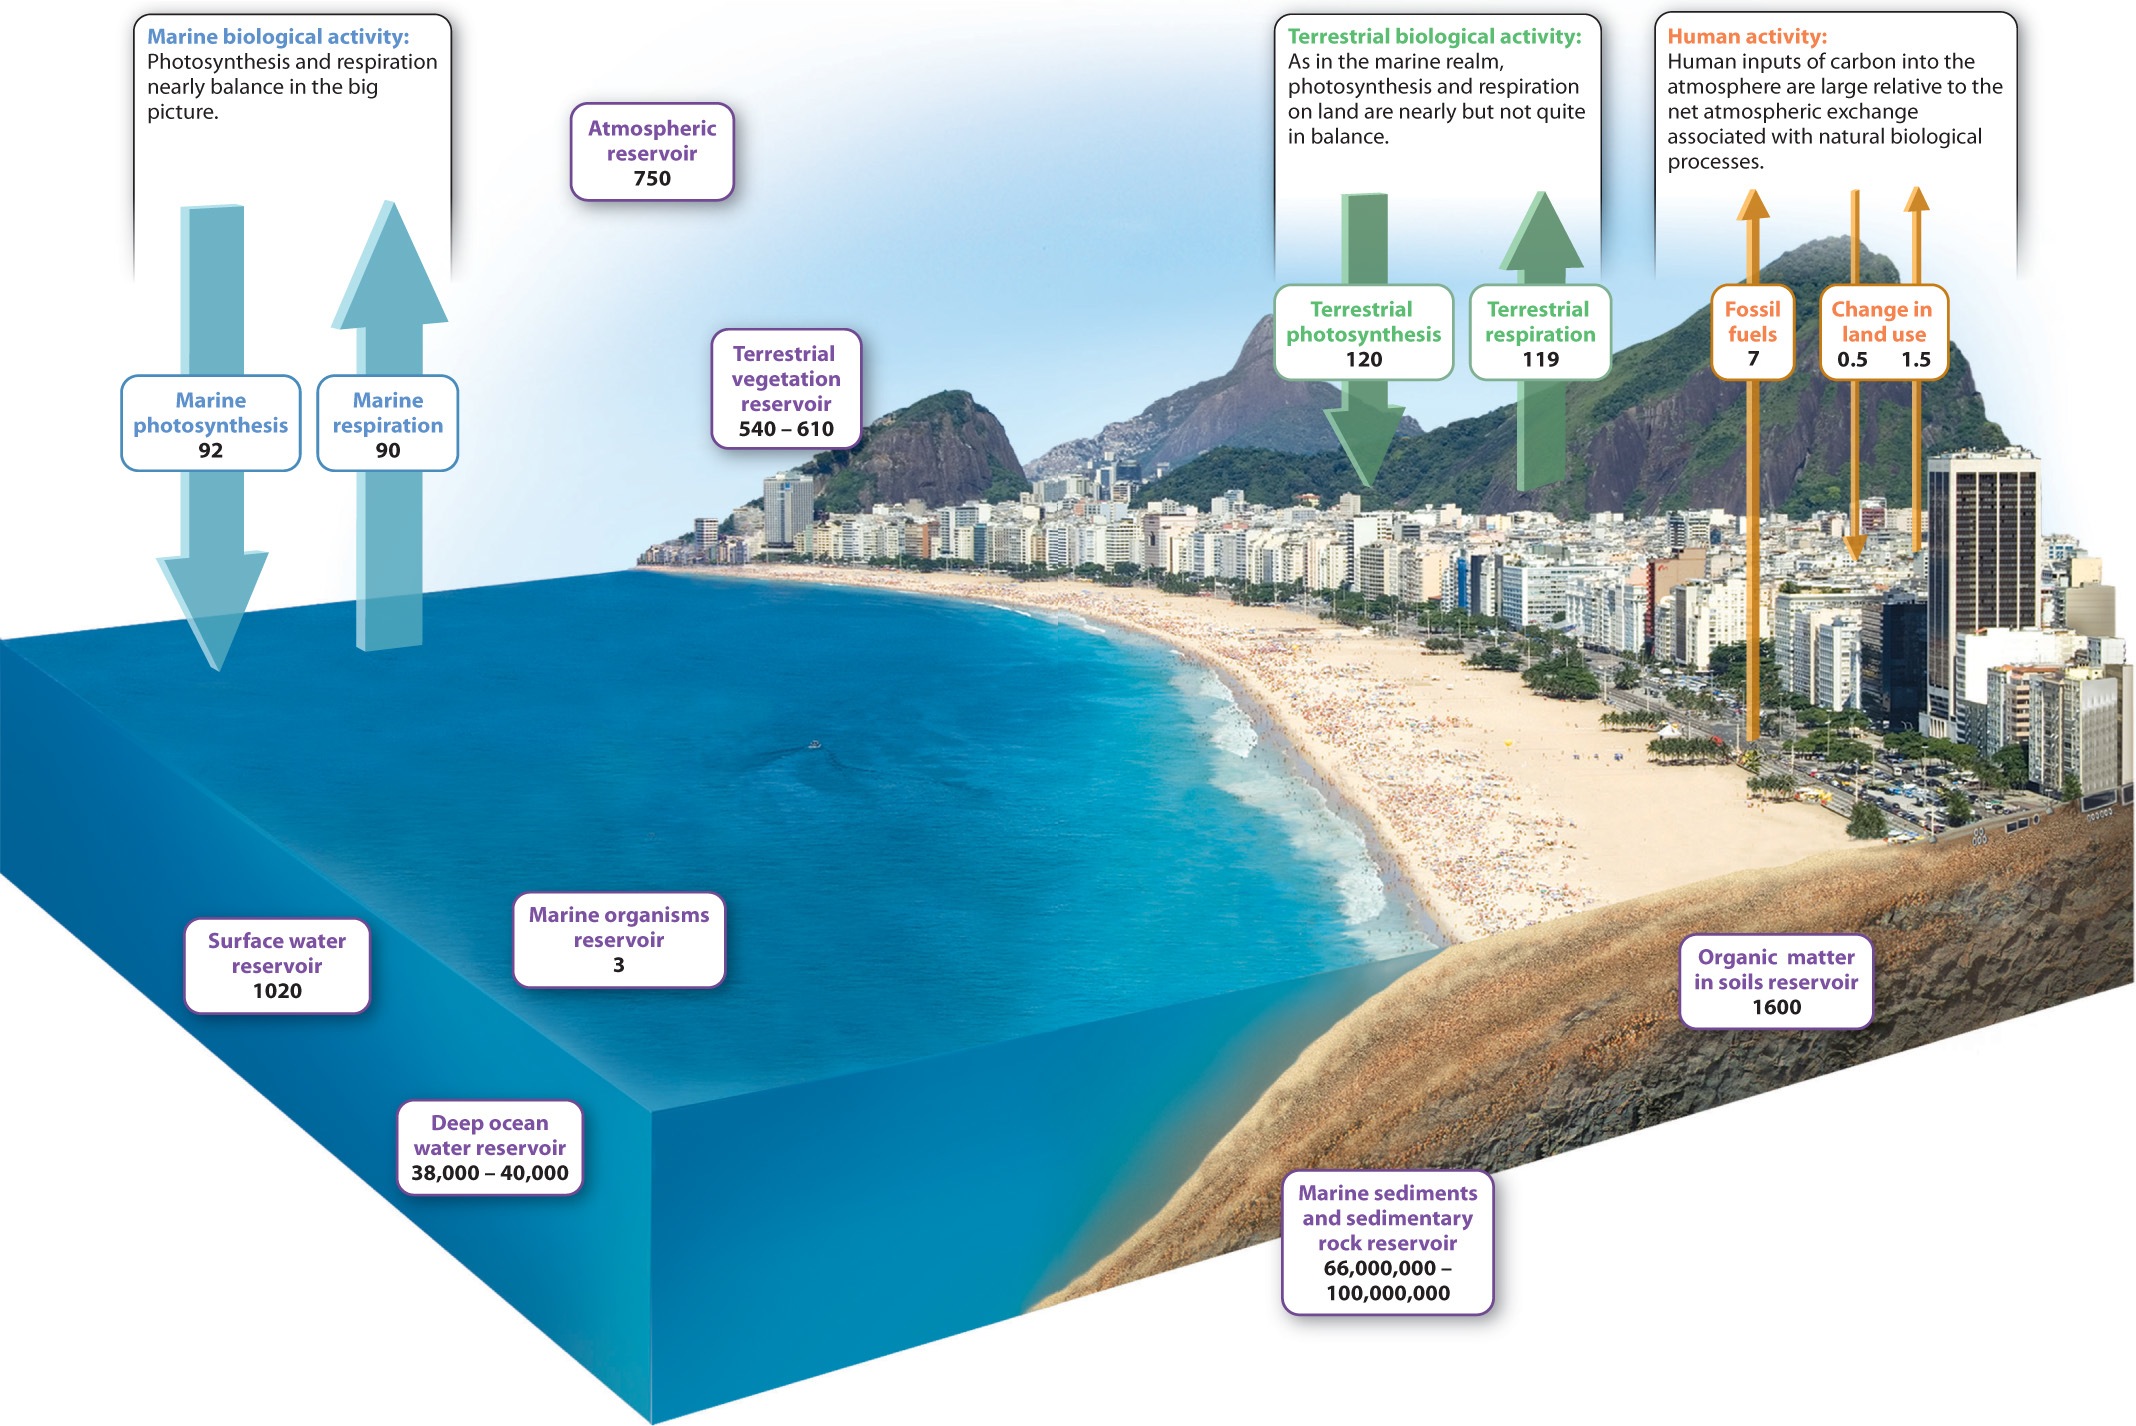
If we add up all the carbon contained in the total mass of organisms living on land, that is, in their biomass, that amount of carbon is just a bit smaller than the amount of carbon stored as CO2 in the atmosphere. Soil, by comparison, stores as much carbon as do land organisms and the atmosphere combined, mostly as slowly decaying organic compounds. In the oceans, the amount of carbon contained in living organisms is actually very small. Much more resides as inorganic carbon dissolved in the water—most of it in the deep oceans as CO2, bicarbonate, and carbonate ions. Perhaps fortunately for us, the oceans have sopped up some of the CO2 generated by human activities.
The biggest carbon reservoir of all, however, lies beneath our feet. Calcium carbonate minerals (CaCO3), which form limestone, and organic matter preserved in sedimentary rocks dwarf all other carbon reservoirs combined by three orders of magnitude. Coal, petroleum, and natural gas make up only a small part of the organic matter stored in sedimentary rocks, but as we have seen, they play an important role in the modern carbon cycle.
Fluxes are the rates at which carbon flows from one reservoir to another. The sensitivity of different reservoirs to change depends on the relative sizes of the reservoir and of the movement of material into and out of it. When fluxes are large relative to the size of the reservoir, reservoir size can change rapidly. As mentioned earlier, the amount of carbon stored as CO2 in air is not that much larger than the annual fluxes into and out of the atmosphere. For this reason, atmospheric CO2 abundance can be influenced by a number of processes at work in the carbon cycle.
25.2.2 Physical processes add and remove CO₂ from the atmosphere.
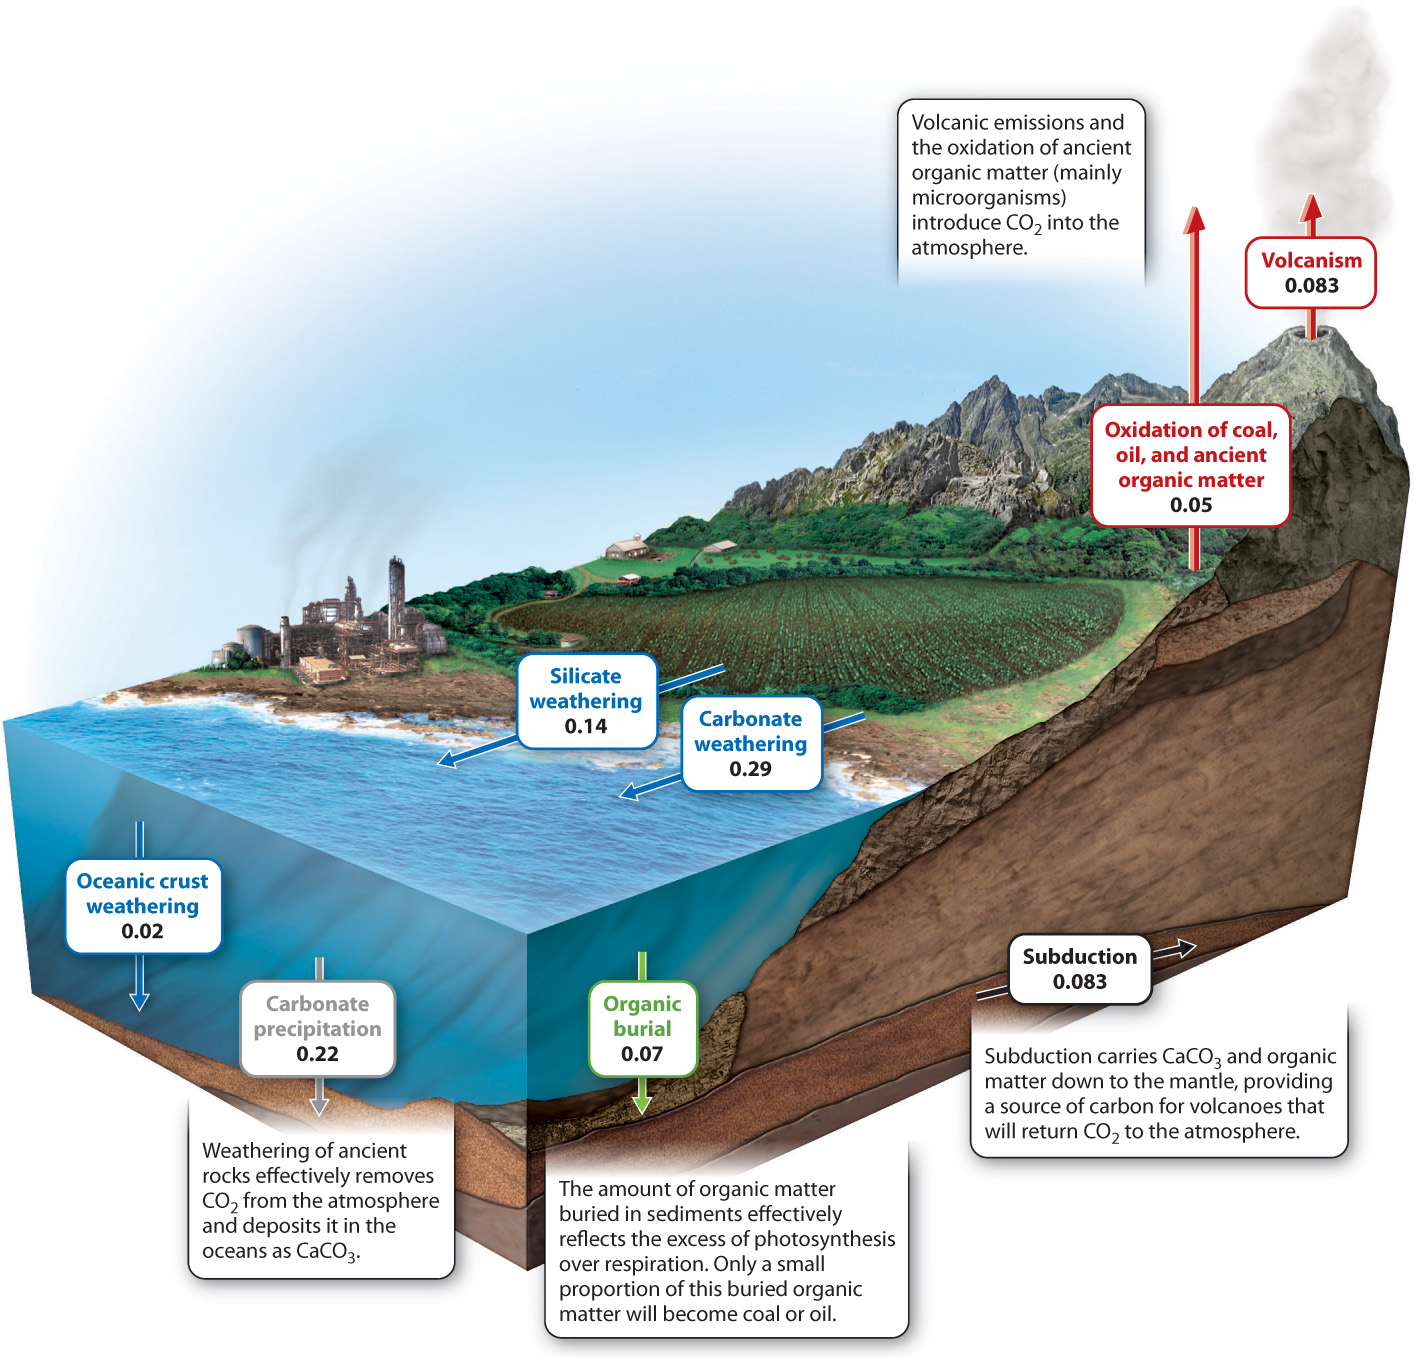
Physical processes, like biological ones, are capable of adding and removing CO2 from the atmosphere. A key process is volcanism: Volcanoes and mid-ocean ridges release an estimated 0.1 billion metric tons of carbon (as CO2) into the atmosphere each year. More CO2, about 0.05 billion metric tons of carbon per year, is released by the slow oxidation of coal, oil, and other ancient organic material in sedimentary rocks exposed at the Earth’s surface. In nature, bacteria and fungi accomplish most of this oxidation by respiring old organic molecules. Burning fossil fuel accelerates this process dramatically, increasing a hundredfold the rate at which sedimentary organic carbon is oxidized.
Carbon dioxide is removed from the atmosphere by chemical reactions between air and exposed rocks, a process called chemical weathering. How can air and rock interact? To understand how weathering fits into the carbon cycle, we must first understand that carbon dioxide reacts with rainwater to form carbonic acid (H2CO3). This acid slowly reacts with rock-forming minerals, generating (among other substances) calcium and bicarbonate (HCO3−) ions that are transported by rivers to the oceans. Within the oceans, the calcium and bicarbonate ions react with each other to form calcium carbonate (CaCO3) minerals that accumulate on the seafloor, forming limestone. In essence, carbon moves from the atmosphere to the sediments, where it can be stored for millions of years. The two linked processes of chemical weathering and mineral precipitation in the oceans can be summarized by a simple chemical reaction (here, CaSiO3 stands in for rock-forming minerals as a whole):
CaSiO3 + CO2 → CaCO3 + SiO2
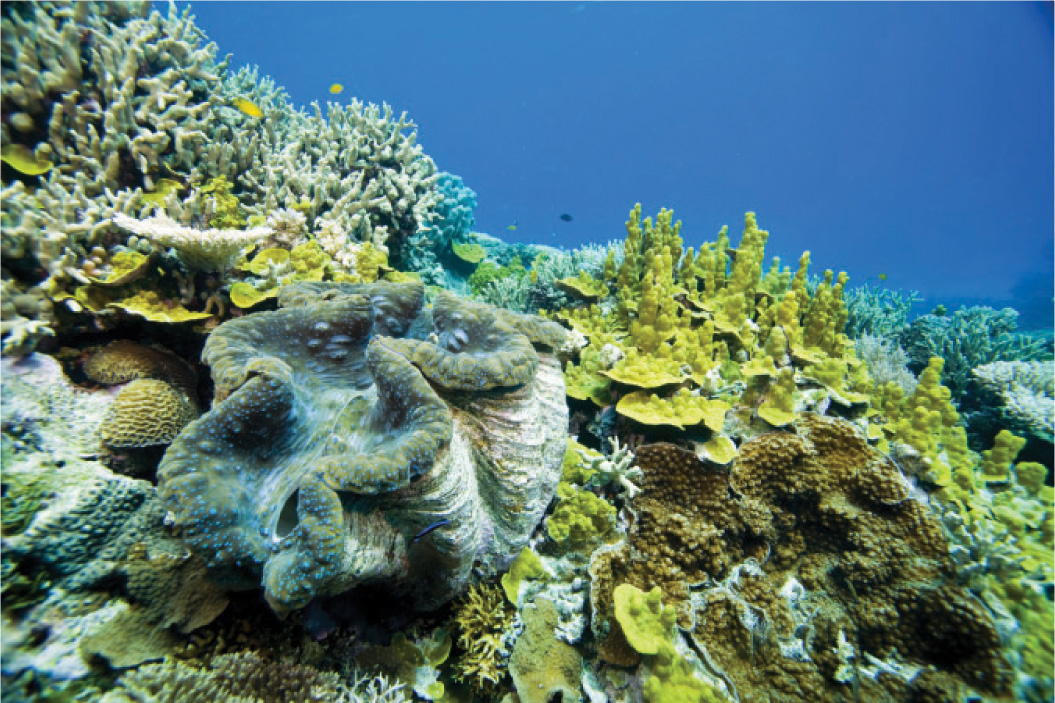
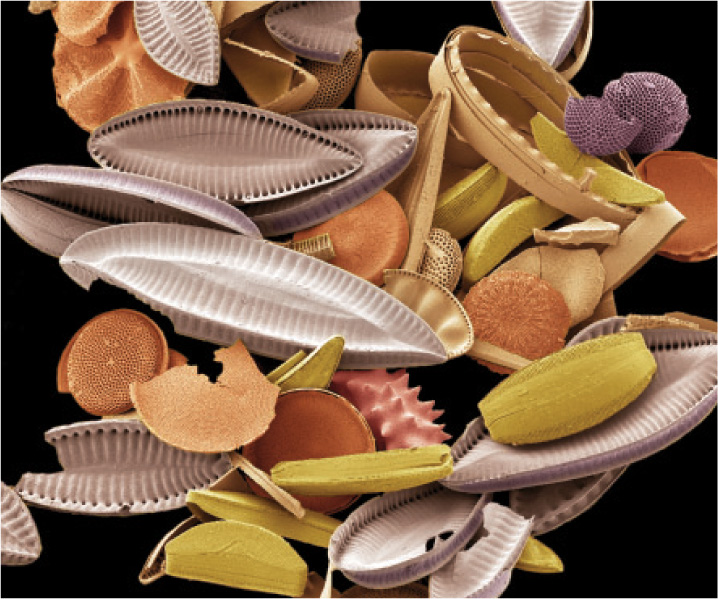
In present-day oceans, the carbonate minerals that accumulate on the seafloor are precipitated predominantly as skeletons and shells. Clams, corals, and many other organisms form beautiful and functional shells of CaCO3 (Fig. 25.7). Silica (SiO2) also precipitates from the ocean water largely as skeletons, especially as tiny but exquisite shells fashioned by single-celled algae called diatoms (Fig. 25.8). Skeleton formation is an example of biomineralization, the precipitation of minerals by organisms. Biomineralization provides yet another link between Earth and life, and one that has varied through evolutionary history.
The annual carbon fluxes associated with geologic processes are small relative to the yearly inputs and outputs from photosynthesis and respiration. As we see in Fig. 25.6, however, photosynthesis and respiration more or less cancel each other out. In the long-term carbon cycle, it is the net result of these rapid biological processes—photosynthesis input minus respiratory output—that matters. Is CO2 produced or consumed when all biological processes are considered together?
Today, the amount of carbon incorporated into organic matter by photosynthesis is actually a bit larger than the amount returned to the atmosphere by respiration. The difference amounts to about 0.05 billion metric tons per year. This number, you will note, is on the same order as volcanic and weathering fluxes. The “excess” organic carbon produced by photosynthesis is deposited in sediments as they accumulate on the seafloor, sustaining a small but constant leak of material from the short-term biological components of the carbon cycle to long-term geologic reservoirs.
One final set of geological processes completes the long-term carbon cycle. The Earth’s crust is constantly in motion, propelled by heat within the underlying mantle. Plate tectonics is the name given to this dynamic movement of our planet’s outer layer. New crust forms at spreading centers, the places where molten rock ascends from the mantle. Old crust is destroyed in subduction zones, where one slab of crust slides beneath another, returning material to the mantle. Plate tectonics provides geology’s best explanation for the formation of mountains and ocean basins, and it plays an important role in the long-term carbon cycle. The crust that descends into subduction zones carries with it sediments, including carbonate minerals and sedimentary organic matter. Subduction removes carbon from Earth’s surface, but this carbon will be recycled to the surface as carbon dioxide emitted from volcanoes and mid-ocean ridges. Fig. 25.9 shows the physical processes at work in Earth’s long-term carbon cycle.
Quick Check 2
If plate tectonics form a chain of high mountains, would you expect atmospheric CO2 to increase or decrease?
25.2.3 Records of atmospheric composition over 400,000 years show periodic shifts in CO₂ content.
Earlier in this chapter, we discussed evidence that before the Industrial Revolution, atmospheric CO2 levels had not changed appreciably for 1000 years or more. Longer-term records, however, show that the carbon dioxide levels in air can change substantially through time.
At Vostok, high on the Antarctic ice sheet, glacial ice records more than 400,000 years of environmental history (Fig. 25.10). As shown in the top graph of Fig. 25.10, the youngest samples show about 285 ppm CO2 in the atmosphere, consistent with direct measurements of air, including the first years of the Keeling curve. Notice, however, that 20,000 years ago, CO2 levels were much lower—about 180 ppm. In fact, the Vostok ice core in its entirety shows that atmospheric CO2 has oscillated between 285 ppm and 180 ppm for at least 400,000 years. On long timescales, therefore, the natural variations in the carbon cycle can be large.
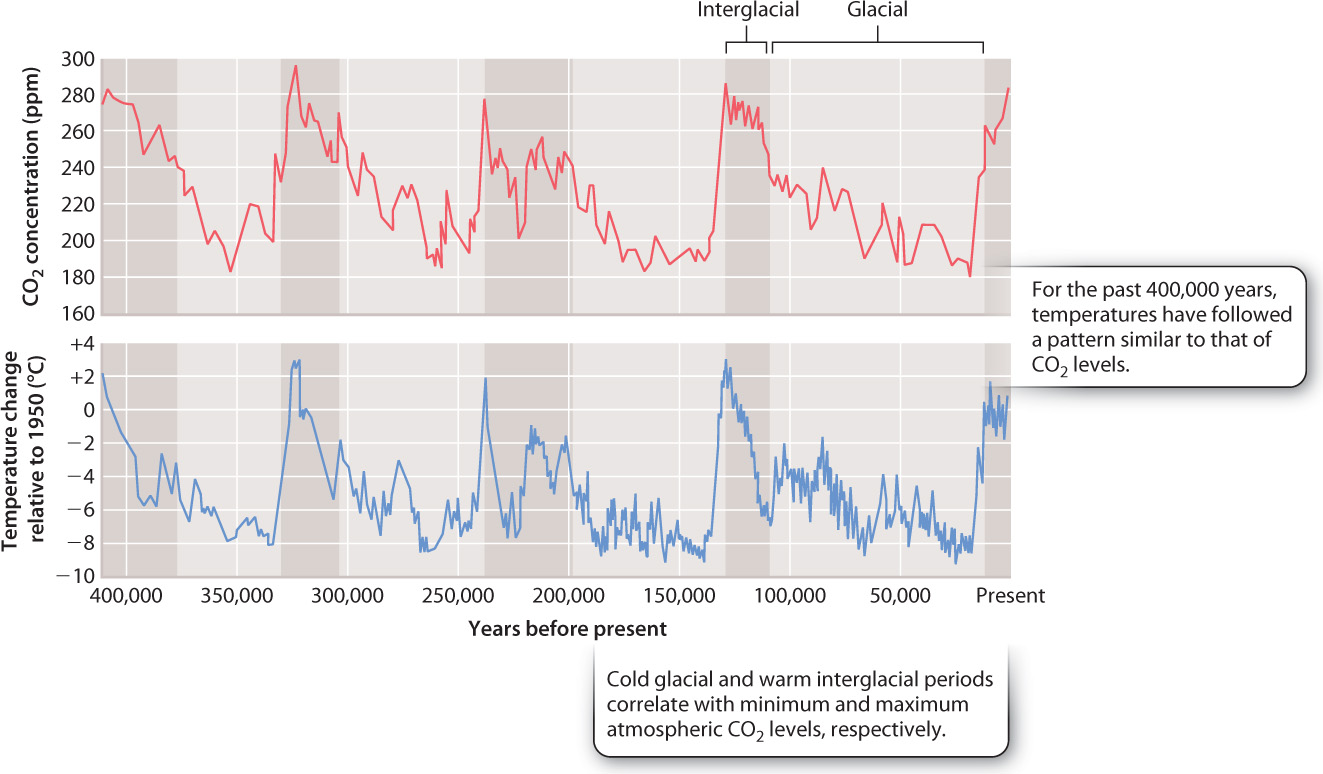
The bottom graph in Fig. 25.10 shows an estimate of surface temperature obtained by chemical analysis of oxygen isotopes in ice from the same glacier. Over the last 400,000 years, Antarctic temperature has oscillated between peaks of a few degrees warmer than today’s temperature and temperatures as much as 6° to 8º C colder than present. Interestingly, the temperature and carbon dioxide curves closely parallel each other. Carbon dioxide is known to be an effective greenhouse gas, meaning that it allows incoming solar radiation to reach Earth’s surface but traps heat that is reemitted from land and sea. Therefore, it is not surprising that temperature and atmospheric CO2 levels show the parallel history documented in the figure.
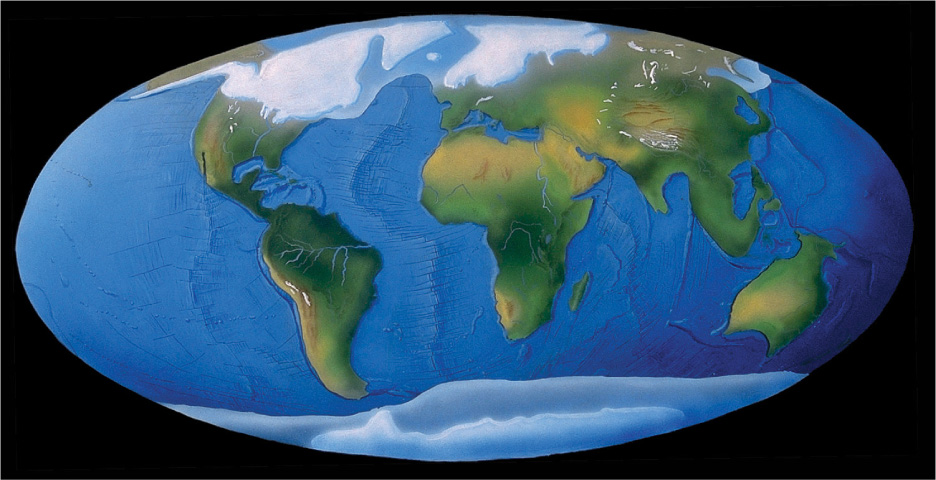
The two curves correlate closely with one further phenomenon, the periodic growth and decay of continental ice sheets. Large glaciers expanded in the Northern and Southern hemispheres a few million years ago, ushering in an ice age. Today, we live in an interglacial interval, when climate is relatively mild, but 20,000 years ago thick sheets of ice extended far enough away from the poles to cover the present site of Boston (Fig. 25.11). The repeated climatic shifts recorded in ice cores reflect periodic variations in the amount and distribution of solar radiation on Earth’s surface, which are caused by oscillating changes in Earth’s orbit around the sun.
The temperature and CO2 increases recorded by Vostok ice between 20,000 and 10,000 years ago coincide with the last great retreat of continental ice sheets. What processes might explain how atmospheric CO2 could increase by 100 ppm in just a few thousand years, as glaciers began to retreat? Can the short-term carbon cycle processes of photosynthesis and respiration account for this much carbon? Certainly, the amount of forests on the Earth’s surface has varied through the past 500,000 years as ice sheets grew and decayed, but forests expand as glaciers shrink, so changes in forests cannot account for a pattern of increasing atmospheric CO2 with the retreat of glaciers. Volcanism and weathering also fail to account for the observed pattern. There is no evidence that volcanic activity has waxed and waned in a pattern that could explain observed CO2 variations. And rates of weathering, which remove CO2 from the atmosphere, should increase as temperature rises, but carbon dioxide levels have actually increased. Something else must be going on.
Scientists continue to debate why atmospheric CO2 oscillates in parallel with glacial expansion and retreat. Proposed mechanisms suggest interactions involving the ocean and its large reservoir of inorganic carbon. For example, it has been hypothesized that during glacial advances, the circulation of carbon-rich deep-ocean waters back to the sea surface slows, causing more inorganic carbon to accumulate in the deep sea. With glacial retreat, the oceans circulate more vigorously, returning CO2 to the surface and then to the atmosphere. Whatever the explanation, the historical record of the past 400,000 years shows that climate can and does change without any input from humans, something we must take into account when considering our climatic future (Chapter 48).
25.2.4 Variations in atmospheric CO₂ over hundreds of millions of years reflect plate tectonics and evolution.
The atmospheric record trapped in glacial ice extends backward less than 1,000,000 years. To estimate atmospheric CO2 levels for earlier intervals of Earth history, we must rely on computer models and measurements of chemical or paleontological features of ancient rocks that are thought to reflect atmospheric CO2 at their time of formation. One substitute for direct measurements of ancient carbon dioxide levels is the anatomy of fossil leaves: Experiments show that stomata, the small pores on leaf surfaces (Chapter 29), decrease in density as atmospheric CO2 levels increase. The chemistry of ancient soils is also thought to reflect atmospheric history. Such indirect observations and analyses come with a large degree of uncertainty, but most Earth scientists accept at least the broad pattern of atmospheric history shown in Fig. 25.12.
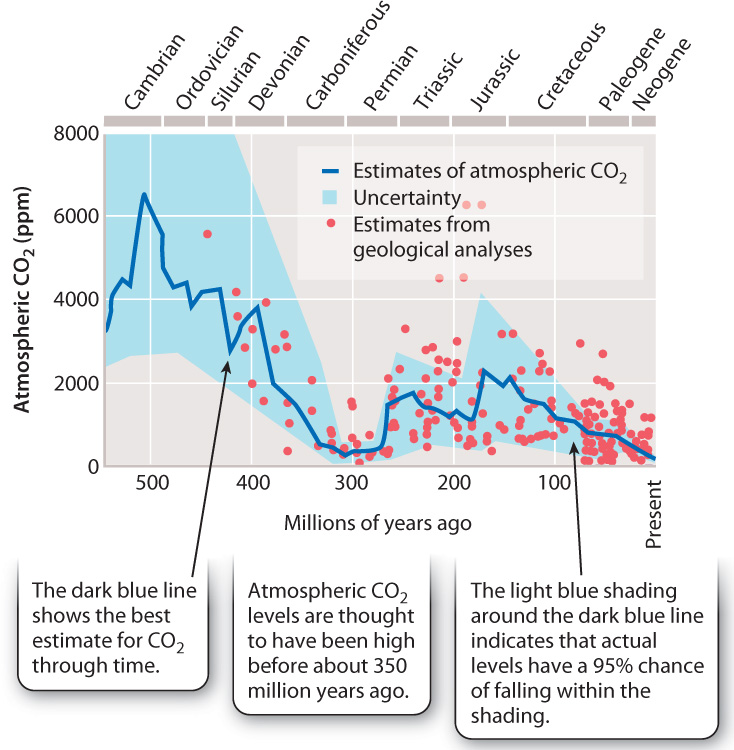
For the past 30 million years or so, atmospheric CO2 levels have probably not exceeded those recorded today at Mauna Loa (Fig. 25.12). Before that, higher levels of CO2—perhaps 4 to 6 times the 1958 level—characterized the Mesozoic Era (252 to 65 million years ago), the age of dinosaurs. Levels more like today’s levels existed earlier, during much of the late Paleozoic Era (350–252 million years ago), another time of extensive glaciation. And even before that, about 500 million years ago, early in the Paleozoic Era, atmospheric CO2 may have reached values as high as 15 to 20 times the present-day level.
Not even variations in ocean circulation can account for the scale of these variations. On timescales of millions of years, atmospheric CO2 and, hence, climate are determined by changes in the rate of organic carbon burial in sediments, continental weathering of rocks uplifted into mountains, and volcanic gas release. All these processes reflect the action of Earth’s great physical engine: plate tectonics. Seafloor formation and destruction together influence rates of volcanic gas release, and mountain formation strongly influences rates of weathering and, therefore, the fluxes of sediments that bury organic carbon beneath the seafloor.
But life plays a role, even here. For example, the large drop in atmospheric CO2 suggested for the mid-Paleozoic Era, 400–350 million years ago, is thought to reflect the evolution of a new player in the carbon cycle: woody plants. The evolution of trees increased the size of the carbon reservoir on land and ushered in an important new mechanism for removing carbon from the air and ultimately to sedimentary rocks. That mechanism was the burial of plant material on land, forming peat and, eventually, coal.