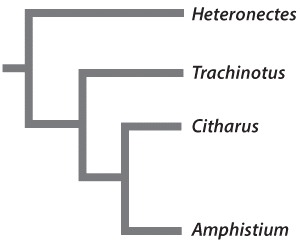
Chapter 1. Mirror Experiment Activity for Fig. 23.20: Does the fossil record contain an intermediate between asymmetrical and symmetrical fish?
Mirror Experiment Activity for Fig. 23.20: Does the fossil record contain an intermediate between asymmetrical and symmetrical fish?
The experiment described below explores the same concepts as the one described in Fig. 23.20 in the textbook. Read the description of the experiment and answer the questions below the description to practice interpreting data and understanding experimental design.
Mirror Experiment activities practice skills described in the brief Experiment and Data Analysis Primers, which can be found by clicking on the “Resources” button on the upper right of your LaunchPad homepage. Certain questions in this activity draw on concepts described in the Data and Data Presentation primer. Click on the “Key Terms” buttons to see definitions of terms used in the question, and click on the “Primer Section” button to pull up a relevant section from the primer.
Experiment
Background
Most fish have symmetrical craniofacial features, where eyes are located on both sides of the body. However, flatfish – a group of fish that lie on the seafloor and ambush prey – have distinctly asymmetrical features; in these fish, both eyes are located on one side of the body. Fossil evidence has demonstrated an intermediate between fish and tetrapods, called Tiktaalik. Does the fossil record also contain an intermediate between asymmetrical and symmetrical fish? Did asymmetrical fish actually evolve from symmetrical fish?
Hypothesis
Much like Tiktaalik bridges the gap between fish and tetrapods (Fig. 23.20), researchers hypothesized that a fossil link exists between asymmetrical and symmetrical fish – one that records the migration of an eye orbital from one side of the head to the other.
Observation
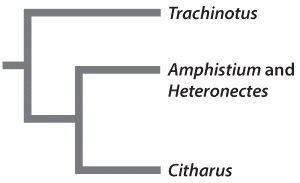
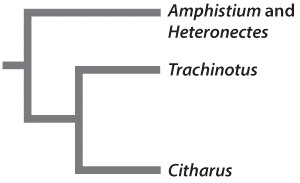
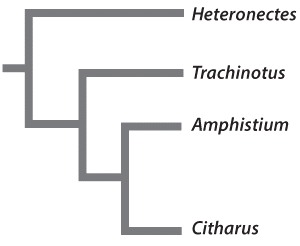
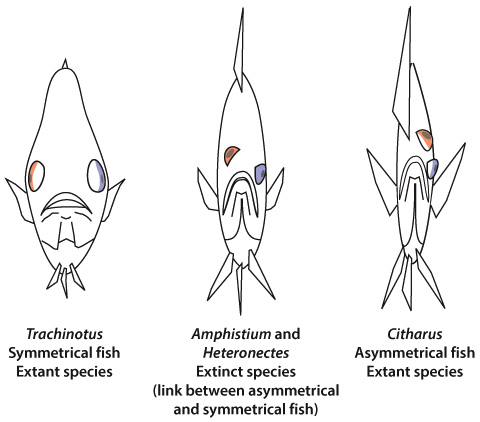
Fish fossils from two groups – Heteronectes and Amphistium – demonstrate asymmetrical facial features; however, these features are not as pronounced as those observed in modern-day flatfish, where both eye orbitals are located on one side of the head. In Heteronectes and Amphistium fossils, the orbital of one eye is typically located further up the side of the head (closer to the middle of the back of the fish). This orbital actually appears to be “migrating” from one side to the other (that is, from right to left) in sequential fossil specimens. In other words, if fossils of asymmetrical fish and their ancestors are arranged from oldest to most recent (according to the time period from which they originated), the older fossils would have two orbitals – one on either side of the head – in roughly the same position (similar to the arrangement of Trachinotus depicted in Figure 1). More recent fossils would have a single orbital located in the “normal” position (that is, in the middle of the right or left side of the head), and an intermediate position for the remaining orbital, one located further up the opposite side of the skull (as in Heteronectes and Amphistium in Figure 1).
Source
Friedman, M., 2008. The evolutionary origin of flatfish asymmetry. Nature. 454: 209-12.
Question
The asymmetric location of eye orbitals in modern-day flatfish and in fossils of Heteronectes and Amphistium has been referred to as a synapomorphy. Which of the following statements is true of synapomorphies?
| A. |
| B. |
| C. |
| D. |
| E. |
