Mirror Experiment Activity for Fig. 36.20: How are neurons that respond to touch stimuli organized in the somatosensory cortex?

The experiment described below explored the same concepts as the one described in Figure 36.20 in the textbook. Read the description of the experiment and answer the questions below the description to practice interpreting data and understanding experimental design.

Mirror Experiment activities practice skills described in the brief Experiment and Data Analysis Primers, which can be found by clicking on the “Resources” button on the upper right of your LaunchPad homepage. Certain questions in this activity draw on concepts described in the Experimental Design and Data and Data Presentation primers. Click on the “Key Terms” buttons to see definitions of terms used in the question, and click on the “Primer Section” button to pull up a relevant section from the primer.

Experiment

Background

As discussed in Chapter 36, the somatosensory cortex is responsible for processing touch stimuli. If someone were tickling the bottom of your foot, mechanoreceptors in the skin of your foot would fire action potentials. These signals would ultimately be relayed to the somatosensory cortex portion of your brain, and then your motor cortex. Following this chain of events, you might quickly move your foot away from the tickler.

If you were to take a cross section of the somatosensory cortex, you would find that neurons are arranged in six distinct layers; the first layer is composed of superficial neurons located near the brain surface, and the sixth layer is composed of the deepest neurons (that is, those closest to the white matter). How are neurons that respond to touch stimuli organized in the somatosensory cortex? Do neurons in the six different layers of the somatosensory cortex respond to different types of stimuli?

Hypothesis

Vernon Mountcastle hypothesized that researchers could create a diagram of the somatosensory cortex by tracking which neurons responded to different types of touch stimuli.

Experiment

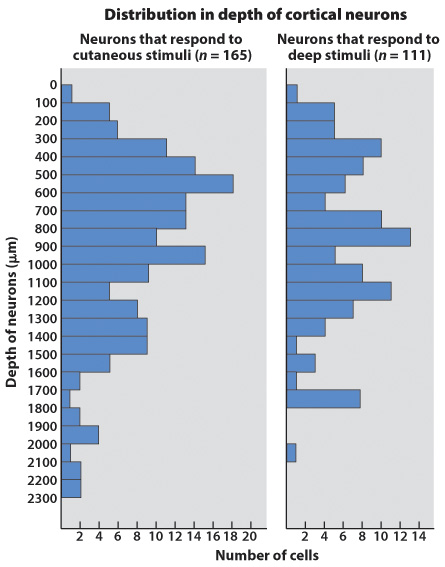
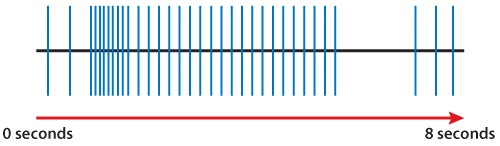
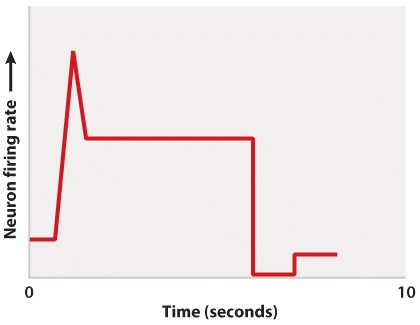
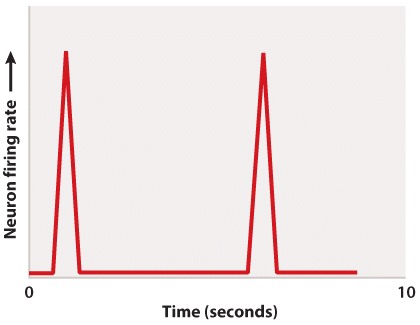
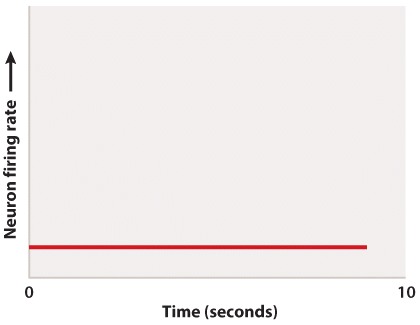
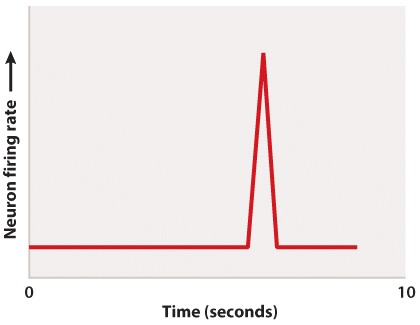
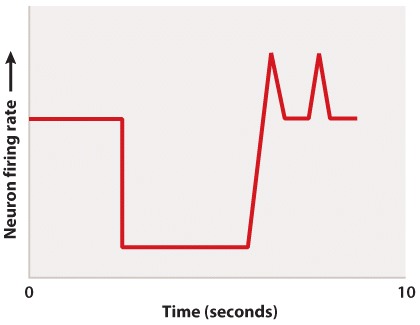
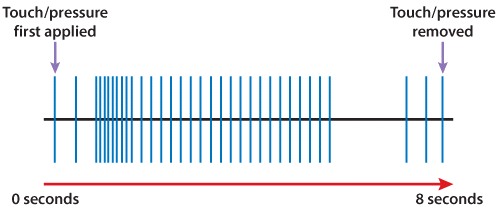
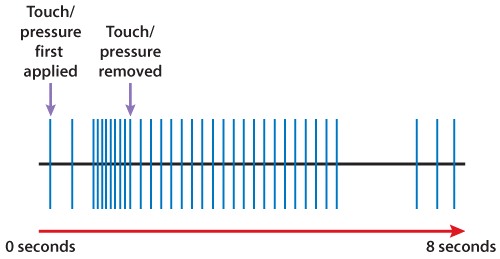
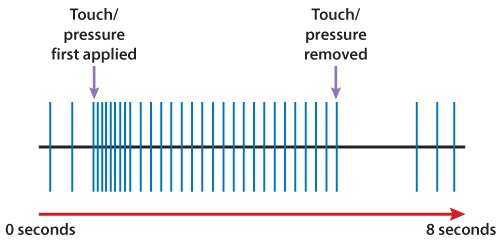
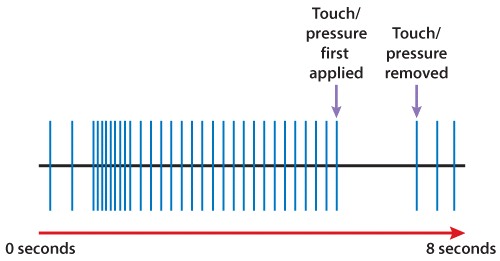
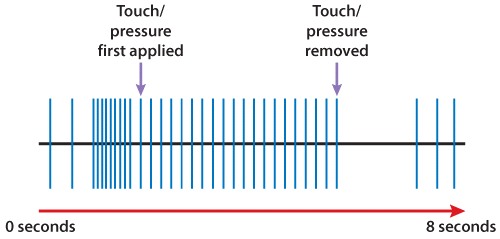
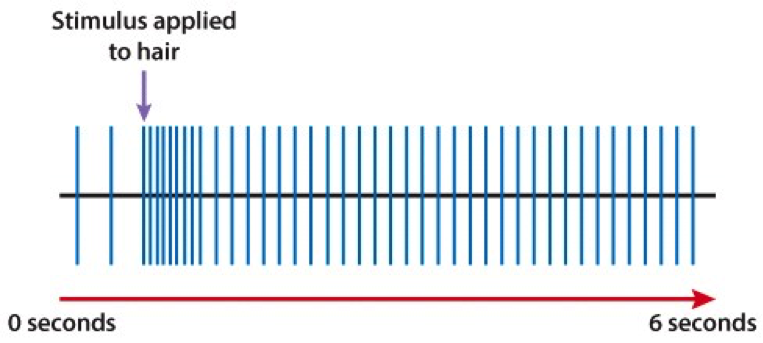
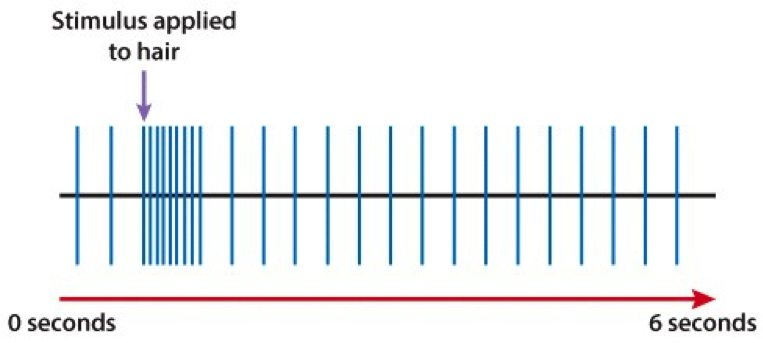
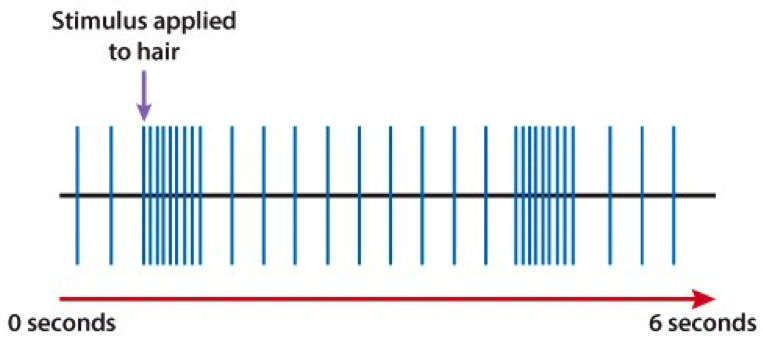
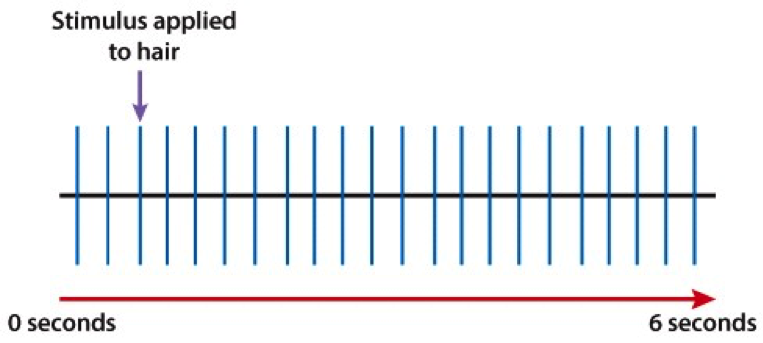
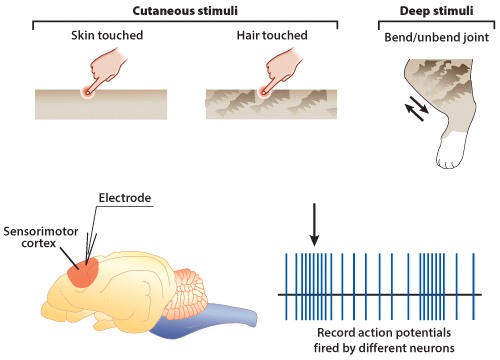
Mountcastle exposed cats to two types of stimuli: (1) cutaneous or superficial stimuli, which included touching hairs or touching the skin, and (2) deep stimuli, which included bending and extending joints or touching the connective tissue surrounding muscles. He was able to track which neurons in the somatosensory cortex fired action potentials in response to these two types of stimuli, and measured their firing rates (Figure 1).

Figure 1

Results

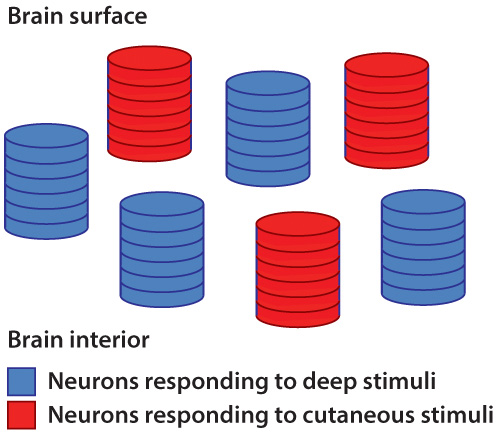
Mountcastle determined that neurons involved in processing the same type of stimuli are organized in vertical columns (Figure 2). These columns are composed of cells belonging to the different layers of the somatosensory cortex. These results demonstrated that just because a neuron responds to deep stimuli does not mean that this neuron will be found deep within the brain; similarly, a neuron that responds to cutaneous stimuli will not necessarily be located near the brain surface. In addition to identifying vertical columns of neurons, Mountcastle also determined that these columns are arranged in a mosaic pattern in the somatosensory cortex. Columns composed of neurons responding to deep stimuli occur side-by-side with columns composed of neurons responding to cutaneous stimuli.

Source

Mountcastle, V. B., 1957. Modality and topographic properties of single neurons of cat's somatic sensory cortex. J Neurophysiol. 20: 408-34.

Figure 2

Question

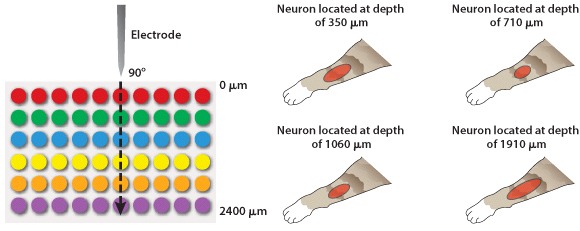
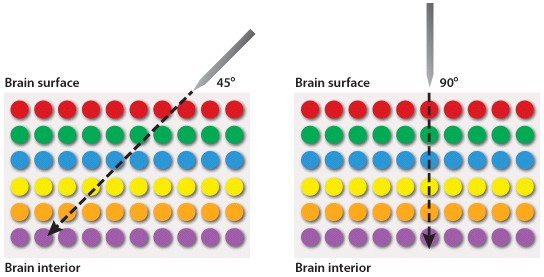
Mountcastle noted that within the somatosensory cortex, neurons that respond to the same type of stimulus (deep versus cutaneous) are arranged in vertical columns. One way Mountcastle discovered this vertical arrangement was by inserting a measuring device (to record action potentials) into the somatosensory cortex at different angles. This approach is depicted in Figure 3 below. Which of the following statements is true regarding measuring devices that were inserted into the brain at angles of 45° and 90°?

Figure 3
Od/++7Cw1QsRqLGvLEndSZX0eJl5XzGrktuPHBeALN8/oTADzmjObfonWiOaV64VXcO/tcvk3hFxkPlMwo0LpE8xcoh/sPfwYcEU7rZdb/12Q6AbOpS0+P+4mFpfglQaz2Yt6qof5q5AzjEqmzIWIIIBN68GMm3peL0jYwnGDo+GAq5gSTL3C43uU/eu1hIxwHccVl9m+0wpBg4ydhSXZBmcy2+G7t8YSEslHxkFa+heuTgTulmfeKddpbDFFAntP8bQ3qrfc20udYyGWc5E8KZ5BH5V21iD4Zj005TIsfMIiLwCuIrM6Y1jGFERCAOIVwfghXYpV/Z1TJ0zYV6UZ8wY/XvavwQpNnA0GOTLAYxZnoXdmicxfOj3CMSY1WXaXEp/8z/IpjTKigquTsHjHEV40pXC/0H34gUjWhM89G0QVYnlokhmZDW4pC1vL6Y56cFwNSBtHQegaI94jHJONaYTA8VCSDQ0OwPjbQnRMP6wr/QNvLso+3Z+sf3srje6fbKtY00IU8/3jj5LFK7tLn/40BHpIoI01+AOa/1yvOcy+PrvQrhnN250X+JIFi0hCK9ovIvbGH+kZzlaz5/t3Xe8C9Xj/fCAX8rGobREcDUmjg0tiLmoHBD8W9X/o9csKLC38KIDgaffAd5ndFCLSPw0QD5P0tCJ3W3TQly0ftFBV9vhHdl1PDqvzTEAHlS+jDrg2WH0eSLZaXx+m5mYjvV1C7RU076WdU1JjihIH0dPW8dg4WM3ocwcMmeWLvx0irsEptM1gHKenJ45Av4Fe0I6+BwObXiICnP6USyRSXWwavpFm9+l9nb7b/Z8H5NfMKAacOw1I08SwiXdcNE3grpD/usXQNEGlLjz1dxQDR5E3T/+yC8BWUfrlvR67BvQFmvPy14RDr5W4gFQuI5ny1wmyse1+9K9+muVwdTNUzyEGpQ61YbvN3wElxXvNrpXkfqjb01vJc3Zd5F8KeWUK5OlJSD0LYuwr1ClDStOhVKruNwb2usITNEMBTmCZHTXiB1q8eDYzXbsY/cwvkMeLPPLXXm+IucPQOz5SAc/xXuiyFSlBoIMcBIQcg3Ytm2V+v5sE3wALIlzNLOeiKSS2vCbjN3ifiIzekcGbt5FR06Xm+oFAFIIuKXHm7uXrzf9kgFhfnye8rAjbA1aJODKllMuDEUPjkqyapNgdIrHW59dVku+nI2X60u9dcykHRm0YWGxquur5IyGYLeoajvdeHURq07AaA+nqwzKaa84ZxmVjckGpXobHzOTmzQWwWtmBB/KXCvmGr4kLBdFBF3/Nu4PVXzh5MijIxeAV2FSIxwtz20UI6sMDbL/IYWc67CPQkHrZsTJUAoimyd7NKkAJxR8krwomqpa4bzwroaz0dICdOzaDBuJ5QA1m6HGVDIK19AAGg2w+btB08GGYQm6nfrnWEnCL3FjGATBzcEq5vLaiyzpJ/qarSnlLodR50fIIyHFbFsJRSk/2vac8Awp/sHCIKmYdeL7yPgFluS+dwaxU7tpuuF7v2ldVQGntvOwDRqSW+L9AowgQ7a3HMBVbFfean3V5pi9knMy1q/gHwiKBhUq4OJ3SWY2xdrkiQjYqatxyiY8zLbQ6O4H60rznY9IS0dcJiEtbZBJAc1Ren6QaYijTxYnCAtB6EzSsbn0dX9XE38W95WNYlAsREdiYaeZhdxkz/+nPtoT1tTym0mq2ozxMqnXKlyc0THpr0gb/j0SXe6L3tceXLxkKBpVI4Mcc/HaYwGa1Q4wWc3ZlLHgrvtEwpOwPVTs5xNikLySHbjssVfGe6UOWbUYjbI0afHWsd95hhfkCJiPltV6k2/lW+P6FW+BSciFdrpxrvPXw3EzCoqQSyJiuSGVS/2g4rcr8TN+A3y2EBBDxy8NWEY7YjfUGDpIPVuAeDWqw34QpQat2TK/hI+nTngDO0uUG0EtzXhNjGb2k5FARUQDnG/SnOd2EX/JLNjP17OA3D9AXUlEfrU1xrcw2+vnGUQQaJa4jUqfEX6EXSWmjIko9ftjYkBEpDATKebNbK8vJcvvRw5sSQGhaZeMLZG438WWi94a92TJR7mJFZXO27KRwqB+nyg8rVfrpgEMTioF8Smjy25t35c4wkdzG8Jr2DUSSS2mn796JySrmxS5yo3V8eP/CmoLv7ScmU0+bAvG7uX185Iio63jH3Lo8OSNb49Chh0fVQIvsGVxMx0s1+LXVLb9E6msmd5rJOaZWeNpd8HqtAjqN1aEuKc9q0lX+u5FVpYxUbwXi3Ht
Correct.
Incorrect.

Question

Mountcastle was able to determine the depths at which neurons that responded to different stimuli were located in the cat somatosensory cortex. The actual graph from his paper is shown below in Figure 4. What could he have concluded from these data?

Figure 4

Data from Mountcastle, V. B., 1957. Modality and topographic properties of single neurons of cat's somatic sensory cortex. J Neurophysiol. 20: 408-34.
G/TvYQcutM4uSOAn+5D0y0Iv8OLnSyA9A3ipy9C1emzexxKc6qrMp1oyUhKNed1BK3VCSDQjOLP2frC6oNruV4T5cJ9veclm/ASeXpr2+tuCvz/uA4COAIDiMUOKTDKVIFEk3Zv1Pa3FlBrW9WsK345rruH/KKgmZuV4FNwqjsR47WlTEDLAFLwSJM7cO1m7hsUu9vOY4E4Jw57LqmOTN5ldRzDr65nfD6IwAPx7Dq058LhHCW9LI471S5fd9Fv3/CU9EFQP9bZhoDyAP53rh91iK9CsCXl3rcUyb/mvrMhBg2fkbZ/amkXOBYxbcA4SUTOP0rLT8MGl3xtZlanpYFfo989+8qj9qgoLD2FPx86b+7yALEg36x7I1UBxKiAd0iJVJCyz/n9ulxmJzYF9/v0IDhvGalNyr7T8S+aaYWlievXs3TMjQ2KHkQ+qQLzQfvZXbL/tfWQa9SeNT8QoFEXamn8DFEwjEJwo7YXkhDrZrJXqeifIAWnRpDIGSYiagZelJ7d6XgSl6d73ze38WdfytlC8w01jQQUSvD+JrRuv9uqp1b+suSHEHHNbEjHY1LkIbrsXShjLzjv3QN1/PH0DE9oQn/zDGd3iUon9qHYk1p+u++SysDoYmRmcXtD8SxZ9yX123DyCtM+kw21kGCfFnqVLR64dLH0Q1+F0/PqxIcAXle3v+ZFggMQgR4ghQUza8KWogoNgZOAWhQbfZQg98EjHUV15Qrw7HzZlR4EnYB3i8e0Nx8tkTJKxLn/ldnwVDe9A0Xj/rHsEizkVbxUSyIGtWLUQ0Cvgp5+pgwc09Fiwq22FY3wNZJReBbnjfcGXffSqUKWYvDMAqE8fWjEKf6S4Xrv+vZYUO01PRzVpdVDJ+wMhojtXd56/gd4T7WtgBt1BZY0BMVk0dhmbLilfBOD20aP7KTZEaqvPlMmEmKxVh2V7atSbDFT9w0+qqSb33ksPQO3evHsC1UMLrSW9e93rQmfu75tlVqjpuYYtI/zWxTs/ovp0qykIKhYHBRmMZC6hUtiayJqM63cpp6QazLs7a+K5BLRRUFWgDXQoOjX4JKDcNwJpxMzPShAJCBgQhM64dtzOm0xleuVyyfJAV353yhs3wVvrAKwUiyHWHCsXC8SNpdirxt4o2Pun/piCvh0ZDZgA/VAnU71yU6jc+1B/zLQB7NY1li6I9fGvfTwUZFgCz9H86pUMDLkrqD2lI536bd+qUo9mCsnjxk7cxDkxka4tJN0EhpfAEsSrI8dWckPBU3vnWKhwKf3xO2a2Tx6iK8H2o0uE/6rQfVcEwpeupArEAlG02/Xkl9UG/0JoOZnjlyzS2FPHd9D6Pb+mBazBjFJcwGvRzT1GThz3efMwo2JqKBYh1TLwIe0Yx31ALDFKzdbJsB9yNOu7547ILPbdAOhk10d7j4gacFlaPTR2SXWaMqcwxFSb1lGOWPqhSquECny0SA3gldlgtV0IiZ1j2JrHmi3NI6d2s0ftFa0pfz7OHpUr2f3uMv2nBKqocU6+1IhQn/2ggHkYHbiwANPKOj318NchaGNeClWQJZS6ekVd6UKeMqLWzltWXeN/+u1W3qZkgtaJRqD3uV5UkBhJkt0P4pVgQhPOfagJyjNgXwQoOUK2oXadldL1uj90e2S+kHTV3xlp8BYtrifujikhe+nZZRpQ9IyDUA9kzElh/DpgBGl99ShE6XG4X1Sjj7AcpfZsfl5LARHFZaj/6eRojd8Jr85n010ZaMvTJFrSwF4/cZh6JHRZ5Jq4+w6jTDHIwvvf6brSHXrEKTIsX/pyC0Q=

Graphing Data

Now we can be confident that our numbers are reliable. The next challenge is to present the data. Typically we do this with a graph. Different kinds of data lend themselves to different kinds of graphs. Our mammal species data is discrete—we have clear categories: A, B, C, D, E, and F. For discrete data, either a pie chart or a bar graph would be appropriate. A pie chart divides a circle into “cake slices,” each representing the proportion of the total contributed by a particular category. In our trapping study, we have a total of 61 animals, so the slice representing species A will make an angle at the center of the pie of 17/61 x 360 = 100°. A bar graph represents the frequency of each species as a column whose height is proportional to frequency.

Fig. 1

What about continuous data? Imagine that the data we collected is the body lengths of the mammals we trapped. In this case, we might choose a histogram, which looks similar to a bar chart; only here we have to impose our own categories on a continuum of data. Because they were discrete categories—different species—the columns in the bar graph may have gaps between them. In the histogram, by contrast, there are no gaps between the columns because the end of one range (1–20cm) is continuous with the beginning of the next (20–40cm).

Fig. 2

Often we are plotting two variables against each other. If, for example, we record the time of day that each mammal is trapped, we can plot the total number of mammals trapped over the course of the 24-hour period.

Midnight–2am 2am–4am 4am–6am 6am–8am 8am–10am 10am–12am 12am–2pm 2pm–4pm 4pm–6pm 6pm–8pm 8pm–10pm 10pm–midnight
Number trapped 8 3 2 0 0 0 0 0 1 22 17 8
Cumulative number 8 11 13 13 13 13 13 13 14 36 53 61
Table

Often one variable is independent—time, for example, will elapse regardless of the mammal count. We plot this on the x-axis, the horizontal axis of the graph. The dependent variable—the values that vary as a function of the independent variable (in this case, time of day)—is plotted on the y-axis, the vertical axis of the graph. If there is reason to believe that consecutive measurements are related to each other, points can be connected to each other by a line. Plotting our data on a graph using the values of the independent and dependent variables as coordinates gives us a line graph. This is a good way to identify trends and patterns in data. Here we can see that the mammals in our forest plot tend to be inactive (and therefore unlikely to be trapped) during daylight hours.

Fig. 3

In science, data are typically presented as a scatterplot, in which points are specified by their (x,y) coordinates. Points are not joined to each other by lines unless there are specified connections among them. Here, plotted in a way similar to the line graph (with the independent variable on the x-axis) is a scatterplot showing the time taken to drive from home to campus for a large number of students. The independent variable is the distance traveled; the dependent variable is travel time because the distances are fixed but travel times vary. Overall, there is a positive correlation between travel time and distance (the further you live from campus, the longer, on average, it will take you to get there), but there is plenty of variation as well. Look at the eight points representing the eight students who live five miles from campus. The variation we see in travel time (from 6 minutes to 30 minutes) is a reflection of differences in driving speed, traffic conditions, and route.

Fig. 4

What if there are more than two variables? Three-dimensional plots can be informative (but can also cause the reader headaches). A popular modern solution to this problem is a so-called temperature plot, in which the third dimension is represented in two dimensions through color: red (hot) for a strong effect in the third dimension and blue (cool) for a weak effect.

Graphs are the mainstay of scientific presentation, but you will see many other ways of presenting data in your textbook. For example, studies showing how different genes interact with each other in the course of development are often illustrated using network diagrams that give the reader a direct sense of the “connectedness” of a particular gene (or node). Evolutionary trees reveal the branching pattern of evolution with species that are closely related having a more recent common ancestor than those that are more distantly related.

Methods of presenting data in science are not limited, even in textbooks, by standard approaches. The popular press has developed many graphics-intense ways of presenting data. Think of an electoral map after an election. You can view information on a number of levels: whether the state is red or blue, the name of the election winner, the size of his or her majority, and so on. Scientists are learning that they too can package information in ways that are simultaneously informative and attractive.

Correct.
Incorrect.

Question

Each neuron within the somatosensory cortex has a receptive field associated with it, an area that – when stimulated by a specific sensation – causes that neuron to fire an action potential. As part of his work, Mountcastle mapped the receptive fields of neurons located in the same vertical column. He collected data similar to those depicted in Figure 5 below, which shows receptive fields on a cat leg in red. What could Mountcastle have concluded regarding the receptive fields for neurons located in the same vertical column?

Figure 5
O1UYPYEDXUVH+UPf+N3upNrJFbbN0p2JW5hKHeC46UlOslBV/EEbnEPOkyb02vUJK5rBN0BtKszzT12LJ+k3iZEyEovUdMBpn93curmaBeWWBpqyfxIJj4ePNMKJhdXRZvAZ28BN6p3PgkJcRHRk4iVXysG94NMQZQPBRB9dClbztnhIHJCJuTWOSMPJdf0orFtx4UajhcLVBgWr3l7R1OGTAysfR7/GDu5OtgZlZAbyaIrcfEBAv0kCi6Ad8P1+iycIF5WHpztDZVMfmbx/U7hXAa1ZsShAYNl0hBPUfdkMq6LT7TLVGIVEeNDUK4AKaWRc0s9Bq+h3coA3U72if1bZRYqctlsH6e/P0vDkGcka1arYuFapU3Bi8SuBHNIcbC0M/xUVquyMn8ZoEpe1kvKWIm2xzYgoqJcj6KtfwKbwocU8g32HIGs+CHpO44QRCESNdVdkdt+HFV/+TxnNbnQhOPwfMkjdZKIPdQ8v1RD1M/9Po/morJNqy5EOUWtIJlI71f3S5c/UIeFzAHwvR6YNNDrT/Ssfjsx2mBaEfK6f9qaAI6av4zJ25s5e/RPHB6n3QQ3vHbGyuFK+AvKFF/QeWkIVkZgPwG1dhQE6pmw8giYoEjBmeBkrQZ+dBRSYqUuOIo3WNescVrfvqq6gmRcCFW4YxgUG87Ga1kV056Qp1m5Q078A4S93zfkIpTRXxL61o52gEftyfkB/x3qqlv+AAgKrW4CM3j5OH/6W+HNPNZc00aT1WvE7Z9rBBrF7zUBeDQ6BVj64sI0sj085CxoKLhYjMo28X+tolvnSwXNTh6PIE0EEfp79ePUnrj+Toc48UxaEFtvgTJV9p4P8S6r+snUMEy9Qdd9A3/zWJ6dqd3urZUreSRajlvW8YmmsaXNhsWdkDu7vB29vIFz6ghlA9xwUGDIBx7PuAHzzqI2lau8/kYG3uo8ZezNAZqxLUT0xaL9LxZOFGhBnHo2/sPFSfFUHyxjSD3MP3YkRIhHWBatppwPzq1DzPw8tQ/SmluH6V2qk9JnxNgPvkfuNSG3uOfie+/rs+mQZRZ5n1fDsOlFnvHWHE8dW4gnrdDgcXuG9H+MIasVQdNBVmUCaMBqwO2jLrV3Una+c36iY6JlJ/L4nsIYPoJabNHpbASq0lt6QLi+65uWZ3Gvt1ClTb5PTtWIosrDdscsZW7PPfyjD0+ncs8ZrA0ijFpKGDBijPZ3QlPyylvM/tO9WFqglZtGu+rYM3wlZvgzqyFhzQ06fC8eQ58fgikD8cP6y1GqWz06ObtaUzQiks6Q38FssWFAgYlWoVtNgTGNF8ya6NVaED8M27lh3NkXBzdpcfjjWYpZTTcKI6gUOTOQjaIdKw4fwltHjUkBOLOfzhoAGAllgPDuw2nYbpr+1wPQWj2HQ3jXNB4xN6NnRVna0k8Tk6TG+9EKQBtM6ce3UOKrFeYb/dntXNJzweoZTpkrXVTYg90wzOR2nbeaHFjCBbSbGTlJIIwtvCSb5/4KI+wX5KZXAOGUzD19QC8euCf7eT3xbHDfBRxjMGXc51gIcXpbJHPhFfEcxAbYIvkPLFbMFhGQMOpjBr6uSeWpIBVIlHN3umbe0et8devfC+nL2+YX8V5fRdRkVw29Lzk6eV3ECgzeznc15ljm7V6k9K5B+ATp7nSFiQc70Loj64qNGsL0bwYmcE5Zt9pCy/EkBZ1f81pI9uEHupAX83Yx2TpWu6APHBmpJO+7t/0QLXPRngWz+WYJQHC/u2qdwbRU2efN+UG0qpwrg4CpYCW28+fYUWpdf34c91UVkNJtQFlmODpuCYtoFOR0AqPVVr7xJxREZht2K3+Ucqnq7+w==
Correct.
Incorrect.

Question

In Fig. 36.20, you see a neuron’s firing rate depicted as vertical lines representing action potentials arranged along a horizontal line. During his work, Mountcastle often represented neuron firing data in this manner. For example, as part of his research Mountcastle applied constant pressure to (that is, touched) the skin on a cat’s leg for several seconds, and measured the firing rates of neurons in the somatosensory cortex just before, during, and after this stimulus. For a single neuron, he acquired data similar to that depicted in Figure 6 below.

Figure 6

However, these data can also be represented in a graph, with the neuron’s firing rate plotted on the y-axis and time plotted on the x-axis. Which of the following graphs best depicts this firing rate data?

Graph 1
Graph 2
Graph 3
Graph 4
Graph 5
tXUF5DEeQzOciD6PZQKv7eUY46ZwpMgAGyDl3Mv6f/01xjiavsrzn+wLe1uNDyE/+aNTh5MZfi1VKM5Xu+TKoD4M/16kA69PG+0G1Ff93aWT9w2h45tTMB+XlUwDYxdIxJXwsksg0zc1vQNabGOZkI/zvJUsoCihFb1AQEICVkAdcIsgmbK5PT2IplIHAzmvFhOgtxRAwP55QBmvu2UqtW5pXoADIWlKIx1EWkLho9RmE20To0QVyBJponK3pwRhVEHRpOcxk4vrwaMD6qQDp8qIjDMuPb2oKTUv10DJZ0nMIlO2B2es0ucgJEYm2h+B/+zontv6HKJwVyH6uIp9B7uLWPhL0P31SIzLPl/GyzLk+ZbEcEzsbXBUmi6qebn7T89p3gb/tJMg/acpIKEyikppn3EeqmHHBN/9wihWoZGqTI59Ri4pIc0Im30aOEjB27VMk6qXQgm3Y99cxE5CyV38d4Frr3zfzioUUq4PayPki2cDHIdWvkmYx+uJK7d5XafnxJFeSl3u48/nelZCTOj9o4y41p7ISr1PCI69yro9NAZ7SBs216rcC8T8KvESB1ORT7L0uLWMsDFuj6P1WbXp6idYvDhcoGrUTjfXyqWSZnvL/RCkJ89A3bnW1ojJM6N4XZQc2y9dSZkHaiCzAWJRBWdIuhaQeA85edhRtbYTNecIkBPEV6pm2N35v8LI4nUNnmOCpOydjPJnpS5TYhPFrHmeeiLxaFZCvAsTXh5wZtJfHalXLbgJRJQD+EYAXm4q0G7v5y8KebJvS/HLs0SCeRhDVe+BKxQcpAM9qk6vY6GTVZvl2D0T094MizIWOP8R/ehJq96dO7YNIA0cnGwPBL4E9nIenbFG4Xt225uM/EEPSAqp8hkLzQoBaaeCkWAJ672ggXjevQCe4z55X9qEIGTA+ZHWLGeS53bTjwFq0zh2kuo3p1S+k1Mb6UhosgDG3aOZazJ1xRTLzrH0KZ5B4X2ewjQai3P4kb0ZpND902thW67uLLwovis99MjrVwg5Lx5/Um6V9gVgYOWhOjqfOIk6ISyl5yYBJOvruR2k+PJrRTx5oDyMaidQPgN4BmsIEH3voT049FRT4Iq9DnaIp5N6vyRc+l2DI8sIe4vdEI1J5qrw9B2gh+9BFJKcCZPx5oNkjn4nsx0K5xtO2Ei37599CEdCW+28ffVPjhv/2KwhuezTbDICqkjUbSW9xXpY7mfKhyyitjoMfOYv6h3N4Qnefr6bFsSCwpNYt+JdunB0TSbmWl0+jJbj6ST/kSTreyX/aZ3BztwBlcD1kbO7gEAQv6grvYIfQOsAFj2TVdCzsFpV35YhVLbD0AIefrSYXL0ArbUqCB/X4Df0IKp4zEFbsEKdhGV3DiQAC5flrD5B52AKd5UukyBmjkjEr4M/bift8r9QDJ64z93iIzgrJPU5LpyKdInklL7CYU/4+m1MP9Zgp58L3ybQaGWR7Y9uAZ+Za2b6f70X73tinvNS60sdgdd0aTPEq4FFh7dDzDbU/+vzQDArhay/TW1LFSZXKVmeSxcQagfDsnd7zksxg73ioxIDG8t0igzH1TFySx8ghNF35hFpqRoOOkhwH8+51KCJ5LioFz/z1SdiQgYD6egrJvDtUz2xmHB3r0KPLMQXJyb4yhOQOSPOkH9xw+T5VaGTS7uwPdOHt7GLX1GZFGnopodOFxmLXikgzVJV9VMgXkX0lxcbeEzdU7YLeOqQHNxH4oL8lPL/W2wCrTe/dmXmAx3b6cHOD1Xtk8qQOvJ8GVjgb3ipu5it6RjHyNuA1Ema2AgeUh2ey96+A0rS87BuE29Z8CbY2oYJHwQHgPkZQUo7nfMIwxU8dFiFzBq47gKfwjYqBacKeoxMn15CKYacB4pn9QOrOK90sIIw/7zPTgxxBJYBjpNSjTyTa7y84amVjL1I+v5kWbPYZs7TsJdxHrfom5NaU27xsm1AcZq8qQfcEqcQ/12Y3Gfz84U85VsfxrvKl8vYImc6WPYhI4/f8EbyG8LqZA++JDjppgcXzcwQEE/Du+NYp0mLong7PrxG9f1+FnwdHjeJK9nI+kUoe3FpBmLiV093VGMCz68k/3jrx86yYMLMNP2Q4Lc5OXcbIf1+E9rt5VrojcdNvAGAugzvKZa7OWjwblECj99askJDMZLDaIuBE3rcWSMQo9q0hxXIm/Lg82MihKMFRfeGB35RwrzeiTKr5EVnDMbr5z811lItFBZShrEhBQixL9TKkWw+tTFKxtWb/owah5bWJdXlSXxyndk+UGnMAQstKCT4dTo3vqGgxVcBIIC26ACmjU9W8m8QMAIZc2yfFgBSolYtDr8y0WNdQ11PYHH5M5stvUzJWbDi0Cb7hOE63hnHokS+YSiQPFinvWj+kxKgy5z/wN/BNZ122u9E0R6e26wikr9yEPRPbbWIAX1rHnET/kbuynzMx9PV8aUS7Fpm4HP8FxU8ooLyEKMEuw8NeVp8qP4F7/COPFqYtem+16xIcTpQ3NVX4Ro9EuJvyBIn3pR/urRFed+J5Ghm1eAzLvlJvI4V50ntZuYMICIq9QYsIUsNodCaeSm0C4n+g2Ai7oOuM0hSuSXjtyLGj4F+jZ158GxKWQtjMUIDJfngIuvFZtCK1e4r7NFjvERTNrW3V0tzq+c9qR1arhAmPqDJ0hUlayo24FSa6pcEZu1o7gXdnupSiUNbLKwzDLX+hqEkStw9SaWMk984Xx0xMo40HLZD4JkmzTauoyXxe64LtUXEuRi+U6BxOGqpQSUw7XTVHdLeb0F5Bh0+OCW6FXLGgc9W64jW38vm8WENbF63cr1LovuFLOI8C/sc8Rir9YaHU2CHnMnnc3zSWfKewloO3PX37SWtgAQ77wgrySfUwtaoocPfyy2R9/msBL7tq/su7R/o
Correct.
Incorrect.

Question

The diagram and graph in Question 4 actually depict the adaptation of a neuron in the somatosensory cortex to a constant touch stimulus. Knowing this, which of the following diagrams identifies the moment when the cat’s skin was first touched, and when pressure was removed from this area of skin?

Diagram 1
Diagram 2
Diagram 3
Diagram 4
Diagram 5
ki6U1hp54AvfRS5c+AH4BikpCU/pogqa/mElqF99qnC07TShTIjcaCa64j7+rXSmVP3baH14383lVOWzELq7i752qL0wPngYjtwza9j5UbYE5C6dyVMekYEF4yrHsWlI1hJ9OXqQ9arKvpaFBrSzdqoEl6461nAg5Y5ntLMjTAteJfZ0a/w7LpRzXWmyc3IXbSgWL42rj+NBTOIf/sZiOyEGCicilt1Gx1ybUHqrQ7ZNf+PSLMY7PjV+qhaacPgDTI8Kmwce2ASRHanbAyBsm3Zu0Rw9nMR7USbIhI3zjfUZhBGmCkJkNcwlMiqBbeBp4xalw1orW8sya+WTnGCo2R4/ZSTigmmkhG5eorsF8IWUkSGGvGaMC4Re7ndOGJSmz3jtu7JDM4Od+l+EZE0+dl6Sr5+LvIAxKXMpscaxBAYKuAKkYo1hGNdo7Zj6xpsK0CMLLvY85VQKyr3W0tW2Ylwy6Wo0CVyykU4OtQ3nkrA37xtzx5ctpyYnhZz/w2qQFvF7LY0Kh/GR9oLnPEWONh+MH0k5UAQcT0Xn2iay59OJLVoHiq4s4q7JAquRbcPuw/ruLIQFlWUS/7+iQWlMwcAyjRYiqpTtSt+Yvkh/5RjRizO0iCPYppp0sbNf9oaCajN6uQM+zMYaYbqcj5Oozuv/f00dB2ac9sKEaSom6vnsBQBj8n200F08hjNmxFP4asHrZNaO6n1BiXajTVprmFVlW2EJT36qcKsMFGzU/+gWKCfIeL8izTtwmk5xGn+5BqTTqJzDlXSTYh6ge2v/DdLIbK7XAkty8j1PdPkAH+k7ij3aHjjmK3mNEgxnK5X6zc+soSUt7cZg2wvczb9deIaFQW9T9m6xA3+Uqi6Mgl6muUnV4ePuO45jT01hqLO2qDF1y+GCRixAnf7VtpEOfalLtVm+v8fMFeO2Dzsp96kGIOXRbJpBX+643nHy/++uUBZASs7/zoUn8Mm4qJ3GsWOUK+xsz04xYnX7WGCkxpOUZ01xgzj4j9T3BxqzFpbVgHXmtU5BC5YqsBLPWrSIj4h3yfuelLrohsANUwwAcuDuGUA3ZYv435jdF2aYUvEik5xapOzhhdXkr/yaGs8UnEWV905UEBykElXqN1QQZ7YgjCd5a8LU/SEsSDFijQMUhlItZJfVXVno86tFT6Z3hZ3CwzztX4HJTj1CVOC3LDg5Xz+/mN/hB8UhYJRPaIcXJ0b6U6lVcm952fZlTV25vFFWjT+J39QKeJO1DnaanlOsAwzU48TB/+SUNV3XdGnV3aDhGDnjJzrj0B8W1SN2ELmR/H02U8yQP9Ss5+DBBd2gtISmmKUH4JrvGHuRrab5hmJpx5r8MVwijIxwAqWhJkH85u2jSn/rxhymTJ25P7aBKcSYanOgPaogFP3Mpl2O3+P5zbgqtUVW4PluVwzoi6i5oC7/5a3yVi5rO73sLkmh/AJgjLG/DeeZyf5zoR0OmSDuwSzsBKhFm6WpAnWyj+lE/736MVsT7LfRwa2LmU0tvxYTIFhLOBmiXjlnwpCCS2JQxwFymuWr9zN2GT0MAUxoxziUG5iyKpRhqhuHv2tAC+ARArUS8n0cJZaAWL0783KnwBP9IgbKblNcgkbNpiGr8VAgOxBLle/Ap3iighNcrjEdtcVtDf5kmw84z9AwgBqj2r/x+4El803CFeMUEI2mTUcenWlltq0gpOMI+HKDm7D6soyZSj51QmW+ZYP19+FzWTV1uXRXf5ltaAk9cw9FLIjdjnO4E3ZOgAiiaqjJ7F0vfIK7BuhIEf506sWhBuRjHiFIQvhYehz+5IRRECXgj9mVmyOmikpOfj5gWOoF8eaRRYNHyz4zr1yTMAnJtvnS5ML0t35bw953VCxvdoRT/FxuPyGqvlTa8xGbdrOOd2YZPh2eN5sEf31HRxUEhCftklbiLn80MJjHrH09vpoqkUW16QAsEWsMY1oMMUHAtI9weIn33rsaaHcYtDMyqohVyWH8IYrLavvoml61y6TAibKNxBpSv17w6LLUkKazPDjUFBwo58o/FVu89Lyn1Nea0im4ePWvseyoGnj7AIMKzTBvJ9O178Y0ISIc+/Ppo3qQySKluhb3zku1Q94Xmt3XIpgJCb/3+DErobVlphTHrtGnjA2xO25aT8Jx6/7e/0flb+TSQt3blDdStFBCrtGzAI636L1/074+DD8YFsLh3l0DaPCUlvPVCiDPvmwopzHV8C10D2MgzPi/uQb0/bGMroi687TI/hU5n+RKxsPq/hD1+zEfIA82iC5JNjHa1hySO4bd/whcXQaadl0CCapA3msghYF4H/MW0i1J6zt9kKjEZ+iX50oaVOPhlqMPWXdabhZZgqHg/JrcmxMUAdXHc2YWBdpnek07hOE9FzIx3r8dflj0IUwoUItqjEXQdp1hdWaxCLTMobZW+2PRCuk86msKr3oUOz7cQiCtNIZJNZ7RVtf/30QclzUQPMEyRarAtjzqbt+9FQLCK077rfZIw6Yl3lard+dRJ4GBCYwbj1ksBE+YJyhHobSzTZqeOuruxolahm4eYw92OF3i/Z/ZyHvvfWPb80n7vpK/DA2n1pynQp91P01QeIpJaigH8QRrTYJAgpOP/lLOfTWaKZO2aIG7jCA86DBprE56ODblJnqEFz3SFR87JsHFV/AIMeMucJPAYg4pdLa5ky2e/NE7Sw==
Correct.
Incorrect.

Question

Neurons in the somatosensory cortex not only differ in the type of stimuli that they respond to, but also in their adaptation responses. Mountcastle noted that the neuron described in Questions 4 and 5 (and most neurons that respond to cutaneous stimuli) demonstrates a slow adaptation response; during the duration of the stimulus, the firing rate of the neuron never returns to normal levels (the firing rate recorded before any stimulus was applied). Mountcastle determined that neurons activated by touching hairs demonstrate quick adaptation responses. Which of the following diagrams might depict a rapid adaptation response of a neuron activated by a stimulus applied to the hair?

Diagram 1
Diagram 2
Diagram 3
Diagram 4
zeuMQKRucU+NADVbXgusPLJdaOMzcd6FUQeNdY4N38PDM/msV4FnJ3rlVP5HSgCrRDx+UOaVxLRVRV174plktuJ/6PZK2WxOCiTPF4KIlN7fgpHGkcTHrDVwTTPvVUdB8fZb39aCZlACTkmWhpuXdMTiQ0GP3Zu16s8J+k817QVuxT2Tb9N5AuaV5svnQVVEW8prMKOMyiu2MJ8lqhtpXmADdWttXCd/cobffHmw3IdduH61cAOT3piviDE2XpKE+sV6JZJtAJeTsUht+IvwXcp5BYUHqWOSzgJwVj5FpNOEoaRQBmHzS2Oez3ljKn/tMwcFbv9jJHwQZqdEnQbWb/sNjsFqkWYi/yDute/JgK9OMhYl6rpb+9Q8KxLuId7SnL0HwnB/YvHkSI2CCUDzqovkC3epNMU4UgrYm5GNxnhBWQehydc3ERn26WAXCulfzAvNHIbS/pn/X+98wp4ACgqGS0TcWhTsAcSTtAOpNvyUeu2qDAXCjwCKd2S51cEDsQY1kgzJGdZseSO6GsDUgYObh9AwuXauHSk4RO/O1A/HsVYfFRWKVgiIM0EDuaOlrLJAaztGpWTWJYYe0NX2pQukGaHiWeseNLUoucB2PY3b3LEIdgzkENjYxPZTZmLPIgvnJmrti8UPFw7EiSY9lha9eNcCVQN8LSVNIkcXpeZw4Q95moAx3ccRbJ7GIEm7B8XkQ9Ya7WZyaJEC+WBBpIncK/Qqti6TU2bXMfS0cRawLTWCn64ZHDNYYdspCVpK8MHD1UHbSJkZJBUPoMz0TKil/RyplwLvN6LtLaUwEbinc6SI8TQeaKPNkxUH5nUSzX975duBOZe17YGyFnzUS294QUhoBzokcBgRNkfq6HxWr4NKth1DWDoEEx9zkuQzLock/At4A7FdcB59aWNn2oZ3sJrzNT5UnKlw89yeXv5Pb7El57eg/vPB/V2tiVHJ1F4p9ra2W7zL4sEgwgQj1e8NhPDv1POi3woet/eGVqN74F9qPAhBzvdsh73FgWQSGbenhvZyR8X039xi8sDI5nuj2+FD9kRsunus9VyrNxWC7Ssn1+K0TYY+FACuHuPpDpaoJvfgHqLGj9HdghueVILKhFNg1CNvK0ip/NJHrr082qcRxo+xhkD4a9lWUQ1rnqHRm00VZyMqbDRSckWZ2+Q61EECHnOeGwirbYQ8zGJSFsLxYCwgrfFtNpvoiQ6WQDeuxTo9Qb74Ifzp8PTZlmOp46ogeLobuqTUTcBmgwB3HIQzKVnW6sC44eRIognWBA4ax26XZzSxHtVCnZJVQym5U77n7HmuwGsbua3QvuEqs7esEyEXp6vbHX8wDR8kwhDLynjSTCFwgVgMQ8Ztcbv+ikCM4UYSaw4+dJuOFGJTm0CADB6c5pzcLy2vDOo48axxBKmBchXAfrNXXtptf9wpyX5AMHjgS6TcGApckZDt0n/vbc94RZb9wOQPQvQiar0f9C06Cc6sr4+EF6KCrSdwaEa7i/UBzNOJ3YHG+6TED3thgx6b6WlNp79dfwJ74Ul0X/bVNqeqhOyEG/5XzOU343xjiurwI5s7JH+nM8Q4tqNjklEv0ahcigvZ8mkevb172I81A2gqHOYY+JKFbF8L5lILEipXlSJ1tSKJ2b8=
Correct.
Incorrect.

Question

p50vnG9yWm29Y1VsTwcIsAHbFJFjMbjkXemM1XmfpYRwo2KY44BYddwpxSsCZ6sCBBGjpiKb+b3PTh2sb0xgkiS6H6ogm03SqyxwskZx8r0C3eEYvLLpsd262zrfWStlcwZDNIhsgR6+fYlA+0CehLB7KcUU7fQdXr5DMjE/xoBGPhDIgiYAP9AK3WN1XE22/zXJZLf42/pE4VXsJRJa5U2Y5X1iA6C+j42cl1daa9MnnlX4w7KjvadOIBoBHpcaeTIBsyGpMUWon26PlQiudB7KYfO3F1yel53G5tO0vUic4BNYuzVKaxGXYRlfzsgwPvOC3bhhu274kmIU7bLLmiYsABv8aTRfE2xTtLsXu2sE9o5T6RIiCtQQQLlfgxW0G2ajVQLGH5qG7rXapojIWK+w2+r44Ex5bVXxxbKsdMbURm8pk7IG8P/Jiq1t5WTla2wp2UQxzHafdnPMDwzBm12FmqzF3uZHLvX+AX2DzaQrXsTVxUFtnTMwJtVDtCS4nXufBAoSIAzkG2Wp88bcT7VJPDeehSp34PPigB/Zl4p3nEuwk9EpDHuqFgqxc3d0tpzxQFpPBHAz8gi5vszqFyh96jMgcPk7OqWODysrCnEJjL1tvfMuC1peG6z0YRtJSivkTmUw52k7h8qT0F6KPSftI2UW1MgnJZs49nB3kRx3vCKOCBA9i1NRFv4fcQwV9tWKoQpc4p6tNTFrHZTQswJrnxHt6M4GQ/JwTsl8S0iFQLt3qf4gRKSWOR0RC0D6kapmdqx0yDiJx0aNirIG0YNg4qpIyIu5AKd4+x2Zvn0IiUEkBhuXNc1aXHvizguI9TxbC5BIDDgMf1BEPhxlZKgBuDCa8PqDGJQwI7lSZz9AyWLA5/A1tWfvuM1VL9OxKl7+2qAXkdEYAg6RXAKrjI/xJE/dnGYIKLtMQP9hWFmWrfUgZG08sF//L4TriaDCLVf8nNum7Zxm6Saf+ot7Ksrf3LiBjQyJ+npqb7XDXVZ2ATa7nEisnx5fIaC/zYFCHz4rqfZampWRSfw0yys4NYg6RJQNNHc5hYzDvCfkRFxYYpked6Tr7sum9Z10+brB5mxAUb+UXIetPbIy/0UseA5wJ5YQWy94IDlQNAToqwnuDdFZPVheji2K0SRbud5Al31rGgu3SjPMjjoYWxMZEQeWbuNIaCuQI/oIe7asAtmxZsOTgpnJs04LY3ubfx5uqCRjRX8JN6uwlRxKrSFB7auUtAZ/oq+Qp8G5tlyvuHbh7kFEsP4Wz4feB6/cR3Ao4EmncCAJz+sjj9dRtzZsCU6wnsJ1gOfrjxt6mzXUt2iK5o/IZ7hMUNq39BSv8+7IOb1ST3Vann69MidAu/HgEBDUdKYH/1UR9ct49faChlcQvDHEAdmSLg2kXyWXLE1GuXBy/v3fGIgBG+U+McSlL7FvWvP8mK+cQ8iTYsl+l9VxjTcMwd78Pl4wavxFHDB7LihafembHUYyT8pp5qHpq3/pz0uYTcpB8fu60HDvJZfP6ABsXkqtTL3LEDxoAlKC6ngKPXlo4aqBwTDlpe950nrv/0uNjTNQhn4q6UEBR6AURzXMt4GPMsQetpubEA6xHEEKnOzQNzRw+/4htMEzIqSd/OfMLFxgw7T0giL7d5KE4P4yg+drkeFvgbSA6rfWpIW2tNXFpLySbIJXcHLGLPXdu/xEdL0ksRP71vcvUJY6NbF0xH/idIhE7gGfygRYcwS44s1XfRN7DatPzFwb2bCtQyyyGPSTYQYhnToXNfAA2jp//CDowyNTXgWPMEx1Rep5nmBVV+Z2WESEzMeB4Frvi/uI2ARZMpNsbYCeIob4NlDg77+TkXKCXtgg7sVeN2PKDUIaAwfImg3lHNbUbBby5roXo7djWtdaIe/q8rYRxDY1evFXS3jvQ/EXHwBzw0NElTJVD6P+zlF4XDsMatHbJ2ZrNhRrrpVXOXpPpWRAqY/FNxIW0D9j98iRpikK6Wfb94NIN+nI/ysMMzRHXS0PfYKxIs5FlDHIsgaYhrHY4dc+1A0MGoCWI1qR3OYXIG8YwAZW/moxhbPzTi0977iF1944pfw86YQUbvCpVUOLPcsc2O/uk213UIP1CNc6Ew5fkRycjt9XXyStYRVGJRLTnJAs9LzGMi4MiNKPWjTDycLVOZEMl3Anor8=

Negative control A group in which the variable is not changed and no effect is expected.
Table

Experimental Design

Testing Hypotheses: Controls

Hypotheses can be tested in various ways. One way is through additional observations. There are a large number of endemic species on the Galápagos Islands. We might ask why and hypothesize that it has something to do with the location of the islands relative to the mainland. To test our hypothesis, we might make additional observations. We could count the number of endemic species on many different islands, calculate the size of each of these islands, and measure the distance from the nearest mainland. From these observations, we can understand the conditions that lead to endemic species on islands.

Hypotheses can also be tested through controlled experiments. In a controlled experiment, several different groups are tested simultaneously, keeping as many variables the same among them. In one group, a single variable is changed, allowing the researcher to see if that variable has an effect on the results of the experiment. This is called the test group. In another group, the variable is not changed and no effect is expected. This group is called the negative control. Finally, in a third group, a variable is introduced that has a known effect to be sure that the experiment is working properly. This group is called the positive control.

Controls such as negative and positive control groups are operations or observations that are set up in such a way that the researcher knows in advance what result should be expected if everything in the study is working properly. Controls are performed at the same time and under the same conditions as an experiment to verify the reliability of the components of the experiment, the methods, and analysis.

For example, going back to our example of a new medicine that might be effective against headaches, you could design an experiment in which there are three groups of patients—one group receives the medicine (the test group), one group receives no medicine (the negative control group), and one group receives a medicine that is already known to be effective against headaches (the positive control group). All of the other variables, such as age, gender, and socioeconomic background, would be similar among the three groups.

These three groups help the researchers to make sense of the data. Imagine for a moment that there was just the test group with no control groups, and the headaches went away after treatment. You might conclude that the medicine alleviates headaches. But perhaps the headaches just went away on their own. The negative control group helps you to see what would happen without the medicine so you can determine which effects in the test group are due solely to the medicine.

In some cases, researchers control not just for the medicine (one group receives medicine and one does not), but also for the act of giving a medicine. In this case, one negative control involves giving no medicine, and another involves giving a placebo, which is a sugar pill with no physiological effect. In this way, the researchers control for the potential variable of taking medication. In general, for a controlled experiment, it is important to be sure that there is only one difference between the test and control groups.

Correct.
Incorrect.

Question

WGLs+jfljzovaXFUYNFEGLWkxjDsNlaUAN49I/6C6+BJ+BsURGwH4mFdoST/j9CFV9GvXQrhAhnNr+ZcicbyCA8oAQjdlhTXUNrOsmwpZe5skatAR4EOcLEI4a4CenG1ZLpV6/fWrAeBECI8J6WexTCJhVYdy4DqRgLHZMsx0hYNQUFNThsQrJOHwvbFMyNFB89mR86SqHTubhkfN+e+L1F/sXJIT/tvQ1p0ZBPLkii3OtGc7gdbTsFw3YOc8exp3LcPl9Nl3xKmrj11qGUN30t9VgjIDjNAsL2C90581EPjhs0lp8igCMmLAKOyrjAUjcKeWEFCyxi3O9AiCnAot8eY5mtla+6sqKkTUnmWUb44zwqSlaOD5xzRC2iWjG/VHXxxx+5bx61kJrPr3BzqWnml56uW+Vmiq0iaefpfa42JjteItyRocmNVvf1POWl4+5asju+DqU2ViJ6+niNt5JqNBu3RM1CIXQJ03sZK+eVDHd8i3o5c7lPW3Bm/5zz4QCRbrogdRtrjKwYmUFfOJ2+FPg2ndy43QfgdeaPOnVQ8MzR3k1/cMkhaVJeXgq2ilggTogIA/aA9mrX2lILelgSE9YwA2stXTQDCnzir5ImIeo+oSnnw9WktbJYm0m8PljuUmUI3W/YSse9eCiiWqb8fh7dppaYhYJFw3DD7GZqU+c5QNbG8F5zk4IcWhPMXwXk17H1WrvNppcATAp7T65DaoywfX/0xx5iY30U5CsHYsYtd6nllwZtZ1ilP+tWbNphEAVWGuI+Dcw2xOzkpyceg9kUzp4qs4c7pGw+sLzgsmLx2DEBk5od+hrwrYy4HWU71NKy1q5u6U6p9/QHPnoPZgDJ4JmpVNHS3C8Ma6DD6YFCgldzz7KFz2yeN+F1td4NDZtX4+MLIJ+0c3kqUNCshcouxalMSyDs92tuC3D17kgVjtxQ3f1Smqn+P7FLyp/kGEjS+fsTzeesTAXxqNsYmLSb3wr0+CKfzaURYEUeJWvtBS+1GY3BTS4JFI/Jy1cyZUVd2ICNytvGb5Q4Xn55k0y+9DSmhhoJE4dLJftmS8j0JtQv4oj30YXzyuTUzFlOV2+Mn9KngDvtDTrf3CBjg/AGjDdkXLxJ+ndqGjKSbYDe0Zdndt9SQzp3D7pAqF9Qz027zkpA1I2YW8JYEl2WlipdYaTfSGbepmjsQUF9D4n7NBvh40Rt0UcGrCXN831bBaINmEbJCuMFigSV7hXjxcgZMEOTLgI+Qxwkojj8Kw38GEuK3Hiws0rymBYCX75aBPa8PROFdW7Z1zl1txgsyiUxDirGM5Gi5hOlkwOWxHv+GuMXYr2GSSaBMkcZ1SDlUe5Mf+Z4N3m6uar4BtYjgAZrZzGG20qBObBeNKWXdqIly6clVky+lNpDnz1soAzi48FJfAMh3HghnjWWPxmCP6erafAhhDvod5YZX+5Q2RP7Rctq/8v6SkoBWYQcL/35KL5Qa1c1JHgXkI9twNfk8lBwMbsChUWnhYfLxTj/G//glaDkinyYaSIBb2e65ht/Xqxfp7m0BhPVoxtuSkLBkEXy0fhKFKPSkEifwdAe121LQ7yAeRacgkIXxxq1YVgKOmNmeGA2ywKdTVMt1NED71+mjcXH/1a/Bn3/EeqygemlHgEeEr0Iq4Qwv7LttwV8S4o/5oPTunq3nuRljnl83mXKBTc6k9Vny1e8Kd2UUMvpAJRPkh2XGM8ZO2VZcHvIvbg5diJLn1lrdF3wbXnKsPJAcHpZHnsX6v1m12Tu1whERDctIU7IPrCJCywe7avuUMiZ0gIPIhnVQ+UaR+5bn8fsfsN+ZlLz8Q7/hsxM0IZ8930dQ3BVsYyXJxV7FdARgzKNVLIl0JKY+fOJtP0n/hi+aCGJf6iyV3t2cn3MIDLnUyZ+wU5e+FW1aKnCfxJuYa0m7jbWqDqeZGQ6NzhoYWYTtG1owTgOt6DJvsoES4KqdS3CCwWoZYd/IM6Sur+mGe8N5CEkhl9Xu0TfOXGV2UrecfSGnEXCfbGlIkM0zKaUAXTuKlV6nOCMMOarq6TvMzml6vPsDooU1KKf616kzWXEgEwaDzRf93CJaiguUcp0mIhZy78Eh9Uu1LD2jIYSXT99e4bpw/PYc/YTNGJ2JXTW/EYQUtH0hP2av4itCfpLsb76bvBVDso3ALbVQzDSUjqwDMD24TJ9GBb/zDmcCrunW3un5WttGRkn+2oZ5JhN6pKqrA/BYEBkt3aRS25SsYZPfErS/hamuf3BWrTTuDG/QjI+R+M5UAEeOIYckKdBynvGkgKuxk+YzMcEjSNU8OEeR3IRb+YNtX61jHGp/jVxV/vlICW2JHOlZWd6Xa2pS0Rk48a9BtdrtwKRupLvir2NRoRT2wh/wGkXZhglv1fND0k2UMcFobToEp0+qPu2Uo4QaMtY8DxftymZxBXviRMEOAF5gBz1dMrLSCZNOxHKVa6R2siYFJjLLrqb/46oSmmTHBCKdeOsg/THwlcwJ5BxWr3rAr3Slg0ZM9xkngE7ASzDwAqZWl89lcc1Hhf6+gjJ+sykpHy3jske1I2SVAomxxinYvrM/jGXxjxuey8EpTR7+8qogC6OTwxz3Yj+6e1ekQRbjK3p+FYgB
Correct.
Incorrect.