The experiment described below explored the same concepts as the one described in Figure 9.5 in the textbook. Read the description of the experiment and answer the questions below the description to practice interpreting data and understanding experimental design.
Mirror Experiment activities practice skills described in the brief Experiment and Data Analysis Primers, which can be found by clicking on the “Resources” button on the upper right of your LaunchPad homepage. Certain questions in this activity draw on concepts described in the Experimental Design and Data and Data Presentation primers. Click on the “Key Terms” buttons to see definitions of terms used in the question, and click on the “Primer Section” button to pull up a relevant section from the primer.
Background
As shown in Fig. 9.5, growth-promoting factors produced by platelets in the blood can cause fibroblasts to grow and divide. In Chapter 10, we discuss that fibroblasts are cells that contribute to skin structure; they generate a scaffold to which cells can attach and grow. Are the effects of platelet-produced factors specific only to fibroblasts? Can other types of cells, such as muscle cells, proliferate in response to signals produced by platelets?
Hypothesis
Russell Ross and his colleagues were interested in atherosclerosis, a disease that you may know better as hardening of the arteries. Although atherosclerosis is typically associated with cholesterol and diet, it also involves the proliferation of smooth muscle cells (SMCs) in the artery walls themselves. Ross and colleagues speculated that, as a result of artery damage (that is, a plaque beginning to form), platelets in the blood may accumulate at a specific location in an artery and secrete growth-promoting factors. Researchers hypothesized that these factors might cause SMCs to proliferate, ultimately contributing to atherosclerosis. Ross and colleagues predicted that if SMCs were treated with serum or with plasma containing platelets (or their associated growth factors), SMCs would rapidly grow and divide.
Experiment
Ross and colleagues adopted a similar protocol to that discussed in Fig. 9.5. Researchers isolated SMCs from the arteries of monkeys and grew these cells in petri dishes. SMCs were then exposed to a variety of treatments generated from monkey blood: blood serum (derived from clotted blood in which platelets had presumably released growth factors), blood plasma (derived from unclotted blood that did not contain platelets or their associated growth factors), and blood plasma supplemented with monkey platelets. Researchers then determined which treatments (if any) resulted in the proliferation of SMCs by counting the number of cells in petri dishes after a 9-to-11 day culture period (Figure 1).
Photo credit: SPL/Science Source
Results
Much like the experiments of Kohler and Lipton discussed in Fig. 9.5, Ross and colleagues determined that SMCs treated with blood serum grew and rapidly divided, whereas cells treated only with blood plasma did not proliferate (or did so only slightly). When supplemented with platelets, blood plasma could cause SMCs to proliferate. This observation provided evidence that growth factors produced by platelets could cause other cells – aside from fibroblasts – to grow and divide.
Source
Ross, R., et al., 1974. A platelet-dependent serum factor that stimulates the proliferation of arterial smooth muscle cells in vitro. Proc Natl Acad Sci U S A. 71: 1207-10.
Negative Control | A group in which the variable is not changed and no effect is expected. |
Experimental Design
Testing Hypotheses: Controls
Hypotheses can be tested in various ways. One way is through additional observations. There are a large number of endemic species on the Galápagos Islands. We might ask why and hypothesize that it has something to do with the location of the islands relative to the mainland. To test our hypothesis, we might make additional observations. We could count the number of endemic species on many different islands, calculate the size of each of these islands, and measure the distance from the nearest mainland. From these observations, we can understand the conditions that lead to endemic species on islands.
Hypotheses can also be tested through controlled experiments. In a controlled experiment, several different groups are tested simultaneously, keeping as many variables the same among them. In one group, a single variable is changed, allowing the researcher to see if that variable has an effect on the results of the experiment. This is called the test group. In another group, the variable is not changed and no effect is expected. This group is called the negative control. Finally, in a third group, a variable is introduced that has a known effect to be sure that the experiment is working properly. This group is called the positive control.
Controls such as negative and positive control groups are operations or observations that are set up in such a way that the researcher knows in advance what result should be expected if everything in the study is working properly. Controls are performed at the same time and under the same conditions as an experiment to verify the reliability of the components of the experiment, the methods, and analysis.
For example, going back to our example of a new medicine that might be effective against headaches, you could design an experiment in which there are three groups of patients—one group receives the medicine (the test group), one group receives no medicine (the negative control group), and one group receives a medicine that is already known to be effective against headaches (the positive control group). All of the other variables, such as age, gender, and socioeconomic background, would be similar among the three groups.
These three groups help the researchers to make sense of the data. Imagine for a moment that there was just the test group with no control groups, and the headaches went away after treatment. You might conclude that the medicine alleviates headaches. But perhaps the headaches just went away on their own. The negative control group helps you to see what would happen without the medicine so you can determine which effects in the test group are due solely to the medicine.
In some cases, researchers control not just for the medicine (one group receives medicine and one does not), but also for the act of giving a medicine. In this case, one negative control involves giving no medicine, and another involves giving a placebo, which is a sugar pill with no physiological effect. In this way, the researchers control for the potential variable of taking medication. In general, for a controlled experiment, it is important to be sure that there is only one difference between the test and control groups.
During experiments where cells are grown in petri dishes and exposed to different types of growth media, researchers often check their cells under a microscope. When Ross and colleagues looked under a microscope at SMCs exposed to different plasma or serum treatments, they observed cell cultures similar to those illustrated below. (Note: these are rough illustrations representing the photos of cells taken by Ross et al. in Figure 2 of their paper.) Which of the following statements is true of these SMC cultures?
Ross and colleagues counted the number of cells in SMC cultures exposed to different treatments, and generated the graph in Figure 3 (this is a rendering of the actual graph depicted in Fig. 3 of Ross and colleagues’ paper). Reflected in the graph is the fact SMCs in all cultures were initially exposed to a 1% concentration of blood serum. SMC cultures were then treated (depicted by the arrow in the graph) with either 5% blood serum, 5% blood plasma, 5% blood plasma supplemented with platelets, or 0% plasma/serum. Which of the following statements is true regarding the graph below?
Data and Data Presentation
Graphing Data
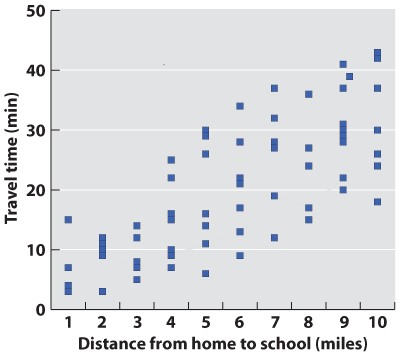
In science, data are typically presented as a scatterplot, in which points are specified by their (x,y) coordinates. Points are not joined to each other by lines unless there are specified connections among them. Here, plotted in a way similar to the line graph (with the independent variable on the x-axis) is a scatterplot showing the time taken to drive from home to campus for a large number of students. The independent variable is the distance traveled; the dependent variable is travel time because the distances are fixed but travel times vary. Overall, there is a positive correlation between travel time and distance (the further you live from campus, the longer, on average, it will take you to get there), but there is plenty of variation as well. Look at the eight points representing the eight students who live five miles from campus. The variation we see in travel time (from 6 minutes to 30 minutes) is a reflection of differences in driving speed, traffic conditions, and route.