Chapter 1. Working With Data 21.4
Working with Data: HOW DO WE KNOW? Fig. 21.4
Fig. 21.4 describes the process by which researchers commonly study allele frequencies in a population. Answer the questions after the figure to practice interpreting data and understanding experimental design. Some of these questions refer to concepts that are explained in the following three brief data analysis primers from a set of four available on LaunchPad:
- Experimental Design
- Data and Data Presentation
- Statistics
You can find these primers by clicking on the button labeled “Resources” in the menu at the upper right on your main LaunchPad page. Within the following questions, click on “Primer Section” to read the relevant section from these primers. Click on the button labeled “Key Terms” to see pop-up definitions of boldfaced terms.
HOW DO WE KNOW?
FIG. 21.4: How is genetic variation measured?
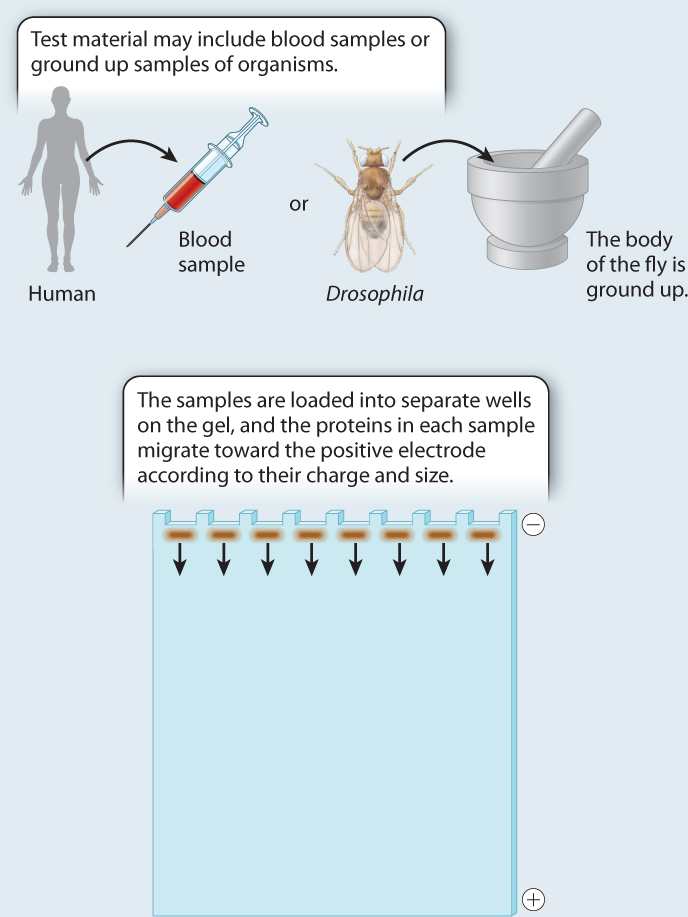
BACKGROUND The introduction of protein gel electrophoresis in 1966 gave researchers the opportunity to identify differences in amino acid sequence in proteins both among individuals and, in the case of heterozygotes, within individuals. Proteins with different amino acid sequences run at different rates through a gel in an electric field. Often, a single amino acid difference is enough to affect the mobility of a protein in a gel.
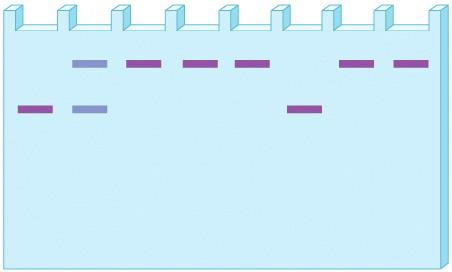
METHOD Starting with crude tissue—the whole body of a fruit fly, or a blood sample from a human—we load the material on a gel, and turn on the current. The rate at which a protein migrates depends on its size and charge, both of which may be affected by its amino acid sequence. To visualize the protein at the end of the gel run, we use a biochemical indicator that produces a stain when the protein of interest is active. The result is a series of bands on the gel.
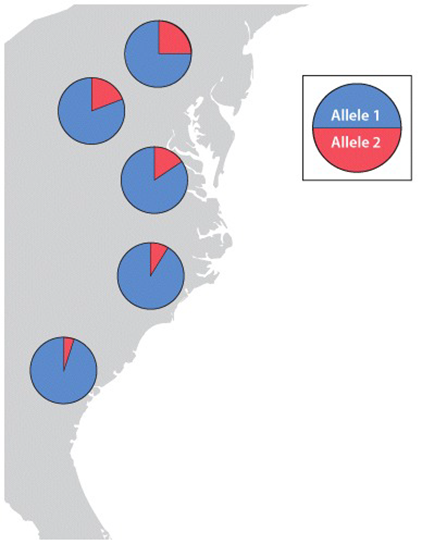
RESULTS The genotypes of eight individuals for a gene with two alleles are analyzed. Four are allele 1 homozygotes; two are allele 2 homozygotes; and two are heterozygotes. Note that the heterozygotes do not stain as strongly on the gel because each band has half the intensity of the single band in the homozygote. We can measure the allele frequencies simply by counting the alleles. Each homozygote has two of the same allele, and each heterozygote has one of each.
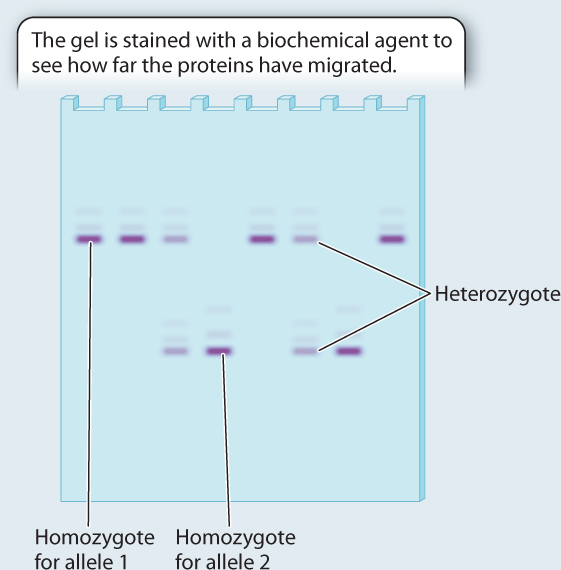
Total number of alleles in the population = 8 × 2 = 16
Number of allele 1 in the population = 2 × (number of allele 1 homozygotes) + (number of heterozygotes) = 8 + 2 = 10
Frequency of allele 1=1016=58
Number of allele 2 in the population = 2 × (number of allele 2 homozygotes) + (number of heterozygotes) = 4 + 2 = 6
Frequency of allele 2=616=38
Note that the two allele frequencies add to 1.
CONCLUSION We now have a profile of genetic variation at this gene for these individuals. Population genetics involves comparing data such as these with data collected from other populations to determine the forces shaping patterns of genetic variation.
FOLLOW-UP WORK This technique is seldom used these days because it is easy now to recover much more detailed genetic information about genetic variation from DNA sequencing.
SOURCE Lewontin, R. C., and J. L. Hubby. 1966. “A Molecular Approach to the Study of Genic heterozygosity in natural populations. II. Amount of variation and degree of heterozygosity in natural populations of Drosophila pseudoobscura.” Genetics 54:595–609.
Question
In a new experiment using the same eight fruit flies from a single population that were used in the study in Fig. 21.4, we study protein variation at another locus, Locus II. Like the first locus, Locus II has two common alleles, which can be separated by gel electrophoresis, with the slower allele designated “S” and the faster one “F”. Here is the gel:
What are the allele frequencies for each allele?
| A. |
| B. |
| C. |
| D. |
| E. |