Chapter 1. Working With Data 22.7
Working with Data: HOW DO WE KNOW? Fig. 22.7
Fig. 22.7 describes a study of shrimp species after a vicariance event, the formation of the Isthmus of Panama. Answer the questions after the figure to practice interpreting data and understanding experimental design. Some of these questions refer to concepts that are explained in the following two brief data analysis primers from a set of four available on LaunchPad:
- Experimental Design
- Data and Data Presentation
You can find these primers by clicking on the button labeled “Resources” in the menu at the upper right on your main LaunchPad page. Within the following questions, click on “Primer Section” to read the relevant section from these primers. Click on “Key Terms” to see pop-up definitions of boldfaced terms.
HOW DO WE KNOW?
FIG. 22.7: Can a vicariance event cause speciation?
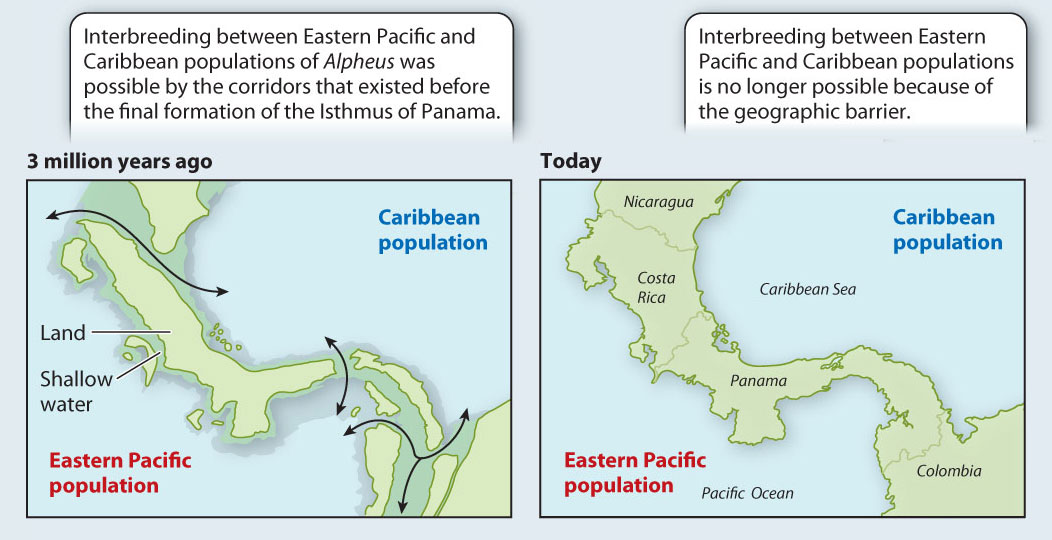
BACKGROUND 3.5 million years ago, the Isthmus of Panama was not completely formed. Several marine corridors remained open, allowing interbreeding between marine populations in the Caribbean and the eastern Pacific. Subsequently, the gaps in the isthmus were plugged, separating the Caribbean and eastern Pacific populations and preventing gene flow between them.
HYPOTHESIS Patterns of speciation will reflect the impact of the vicariance event resulting from the closing of the direct marine connections between the Pacific and the Caribbean. Specifically, researchers predicted that each ancestor species (from the time before the formation of the isthmus) split into two “daughter” species, one in the Caribbean and the other in the Pacific. The closest relative of each current Pacific species, then, is predicted to be a Caribbean species (and vice versa).
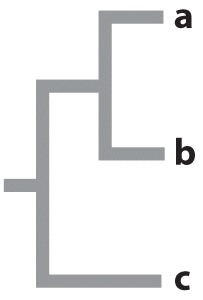
EXPERIMENT This study focused on 17 species of snapping shrimp in the genus Alpheus, a group that is distributed on both sides of the isthmus. The first step was to sequence the same segment of DNA from each species. The next step was to compare those sequences in order to reconstruct the phylogenetic relationships among the species.
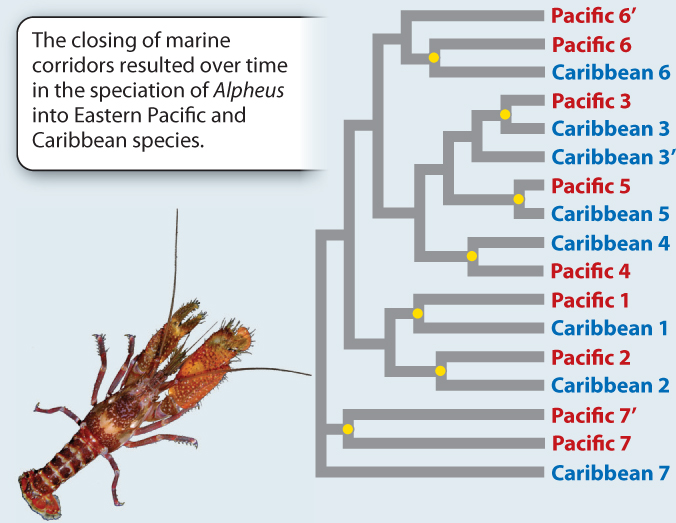
RESULTS The phylogeny reveals that species show a distinctly paired pattern of relatedness: The closest relative of each species is one from the other side of the isthmus.
CONCLUSION That we see these consistent Pacific/Caribbean sister species pairings strongly supports the hypothesis that the vicariant event caused by the formation of the isthmus has driven speciation in Alpheus. Each Pacific/Caribbean pairing is derived from a single ancestral species (indicated by a yellow dot) whose continuous distribution between the Caribbean and eastern Pacific was disrupted by the formation of the isthmus. Here we see striking evidence of the role of vicariance in speciation.
FOLLOW-UP WORK Speciation is about more than just genetic differences between isolated populations, as shown here. Knowlton and colleagues also tested the different species for reproductive isolation and found that there were high levels of isolation between Caribbean/Pacific pairs. Given that we know that each species pair has been separated for at least 3 million years, we can then calibrate the rate at which new species are produced.
SOURCE Knowlton, N., L. A. Weigt, L. A. Solórzano, D. K. Mills, and E. Bermingham. 1993. “Divergence in Proteins, Mitochondrial DNA, and Reproductive Compatibility Across the Isthmus of Panama.” Science 260 (5114):1629–1632.
Question
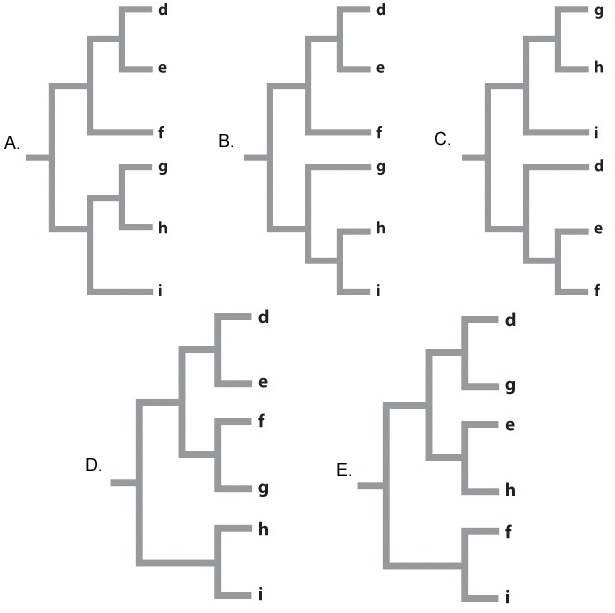
Although we think of the formation of the isthmus of Panama as a geologically instantaneous event – at one moment there was a water connection between the two sides, and at the next there was not – it was likely not instantaneous from the perspective of marine species living close to the shore. As the land bridge slowly formed, so the marine channels became shallower and shallower. The growing isthmus therefore isolated populations of a species that specialized in deep water earlier than populations of a species that specialized in shallow water. Here are some data on the depth tolerances for six species of another genus of shrimp, Beteus, on either side of the isthmus.
| Species | Current distribution | Depth tolerance (m below surface) |
|---|---|---|
| A | Caribbean | 0.5-3 |
| B | Pacific | 0.5-3 |
| C | Caribbean | 8-11 |
| D | Pacific | 8-11 |
| E | Caribbean | 5-7 |
| F | Pacific | 5-7 |
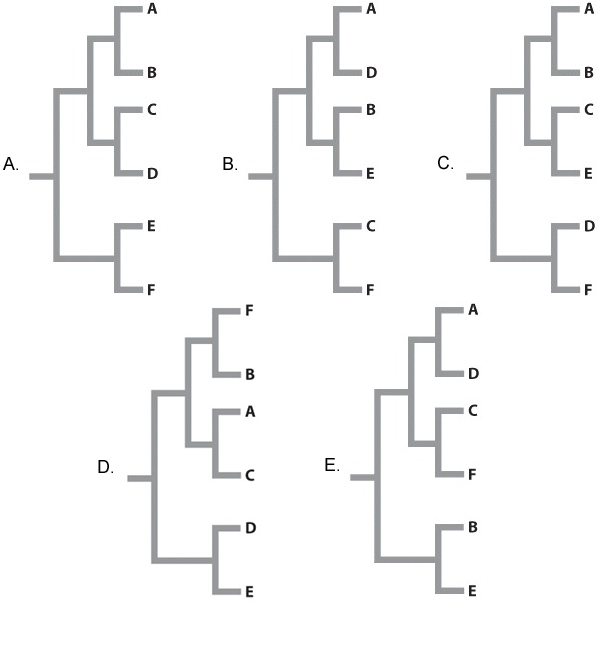
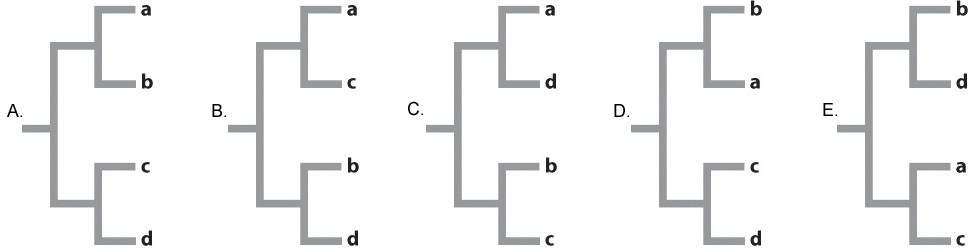
A similar study to the one illustrated in Fig 22.7 is carried out on these six species of Beteus. We sequence 10,000 bp of DNA from multiple loci in each species and compare the number of base pair differences between each species pair (A compared to B, C compared to D, E compared to F). Rank the species pairs in order of greatest number of base pair differences to fewest number of base pair differences.
| A. |
| B. |
| C. |
| D. |
| E. |
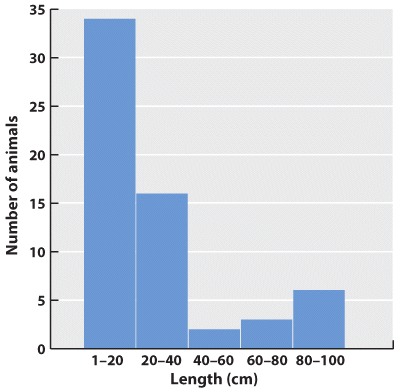
Data and Data Presentation
Processing Data
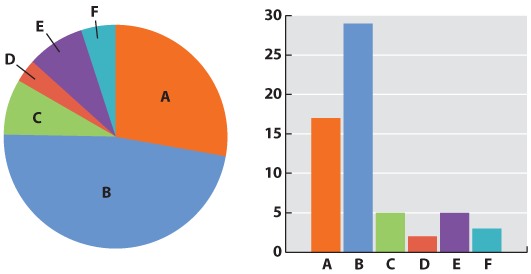
Initially, we have raw data—our series of observations or measurements. Before we move to the next level of data analysis and presentation, we often need to process the raw data in some way. Sometimes, for example, this may entail transforming a long string of numbers into a data table. To do this, we may need to categorize the data. For example, in our forest example, imagine that over a 24-hour period in our forest patch, we count 108 sightings of mammals. The first step is to categorize the sightings according to species and put the data in table form. In this case, we generate a frequency table in which we specify the number of sightings of each of six mammal species, A–F:
| Species | A | B | C | D | E | F |
| Number of sightings | 43 | 47 | 3 | 5 | 7 | 3 |
This table illustrates the pitfalls of data collection and how we have to be very careful when we design our data collection protocol. How valid are these data? We have seen B’s many times, but maybe each sighting is of the same individual. It is possible that all 47 B sightings were the same individual, whereas perhaps the three F sightings were three different individuals. This suggests that the design of our sampling scheme was flawed. We should re-do the census, only this time using traps that can mark each individual. Imagine that the revised method results in the following numbers:
| Species | A | B | C | D | E | F |
| Number trapped | 17 | 29 | 5 | 2 | 5 | 3 |