Chapter 1. Working With Data 36.20
Working with Data: HOW DO WE KNOW? Fig. 36.20
Figure 36.20 describes experiments that were conducted to understand how the retina of a mammal processes light information. Answer the questions after the figure to practice interpreting data and understanding experimental design. These questions refer to concepts that are explained in the following three brief data analysis primers from a set of four available on LaunchPad.
- Experimental Design
- Data and Data Presentation
- Statistics
You can find these primers by clicking on the button labeled “Resources” in the menu at the upper right on your main LaunchPad page, then select “Content by type.” Within the following questions, click on “Primer Section” to read the relevant section from these primers. Click on the button labeled “Key Terms” to see pop-up definitions of boldfaced terms.
HOW DO WE KNOW?
FIG. 36.20: How does the retina process visual information?
BACKGROUND In the 1950s, the American neurophysiologist Stephen Kuffler was interested in understanding how the retina helps to process light information before it is sent to the brain. He focused on the activity of ganglion cells in the retina because they receive input from the photoreceptors and bipolar cells.
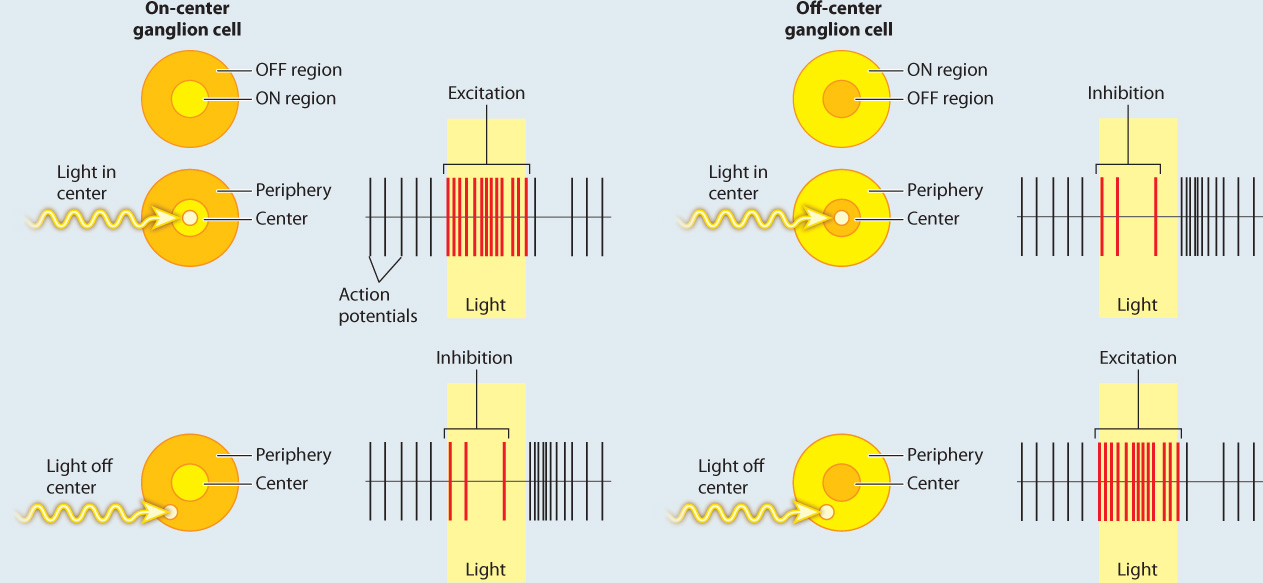
EXPERIMENT Kuffler stimulated different regions of the cat’s retina with localized points of light while recording the action potentials produced by ganglion cells.
RESULTS Kuffler found that there are two types of ganglion cell: on-center and off-center cells. On-center ganglion cells fire more action potentials when light shines on the center of the cell’s receptive field compared to the surrounding region, and off-center cells fire more when light is shown in the periphery and less on the center. These patterns are explained by lateral inhibition of input to the ganglion cells by the photoreceptors and bipolar neurons in the retina.
FOLLOW-UP WORK In the 1960s, Hubel and Wiesel found similar center–surround neural receptive fields, though with enhanced opposition, in part of the thalamus and in the visual cortex of the brain. Cells with these fields enable cats and other mammals to detect shapes of a given orientation moving through their visual field. Similar center–surround receptive fields have also been found in the somatosensory and auditory cortex, highlighting the use of lateral inhibition to enhance sensory acuity and edge detection. Other studies have found similar center–surround sensory processing in invertebrates and other vertebrates.
SOURCE Kuffler, S. W. 1953. “Discharge Patterns and Functional Organization of Mammalian Retina.” Journal of Neurophysiology 16 : 37–68; Hubel, D. H. 1963. “The Visual Cortex of the Brain.” Scientific American 209 : 54–62.
Question
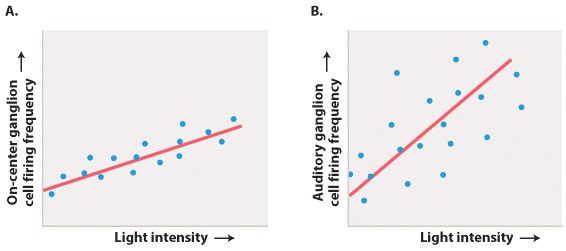
Below in Fig. 1 is a graph of the firing frequency of an “on-center” ganglion cell in response to changes in light intensity directed at the central region of its receptive field.
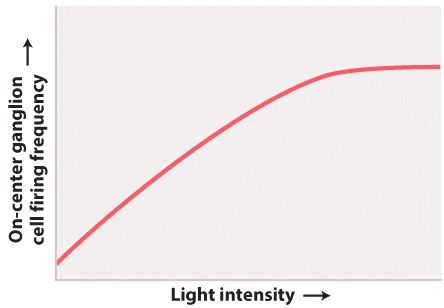
What is the independent variable?
| A. |
| B. |
| C. |
| D. |
| E. |
| independent variable | The manipulation performed on the test group by the researchers. |
Experimental Design
Testing Hypotheses: Variables
When performing experiments, researchers manipulate the test group differently from the control groups. This difference is known as a variable. There are two types of variables. An independent variable is the manipulation performed on the test group by the researchers. It is considered “independent” because the researchers could choose any variable they wish. The dependent variable is the effect that is being measured. It is considered “dependent” because the expectation is that it depends on the variable that was changed. In our example of the headache medicine, the independent variable is the type of medicine (new medicine, no medicine, placebo, or medicine known to be effective). The dependent variable is the presence or absence of headache following treatment.
In designing experiments, there is an additional issue to consider: the size of each of our groups. In order to draw conclusions from our data, we need to make sure that our results are valid and reproducible, and not merely the result of chance. One way to minimize the effect of chance is to include a large number of patients in each group. How many? The sample size is the number of independent data points and is determined based on probability and statistics, the subject of the next primer.