Chapter 1. Working With Data 26.19
Working with Data: HOW DO WE KNOW? Fig. 26.19
Fig. 26.19 describes studies showing the abundance of Archaea in the oceans and their metabolisms. Answer the questions after the figure to practice interpreting data and understanding experimental design. Some of these questions refer to concepts that are explained in the following two brief data analysis primers from a set of four available on LaunchPad:
- Experimental Design
- Scale and Approximation
You can find these primers by clicking on “Experiments and Data Analysis” in your LaunchPad menu. Within the following questions, click on “Primer Section” to read the relevant section from these primers. Click on “Key Terms” to see pop-up definitions.
Question
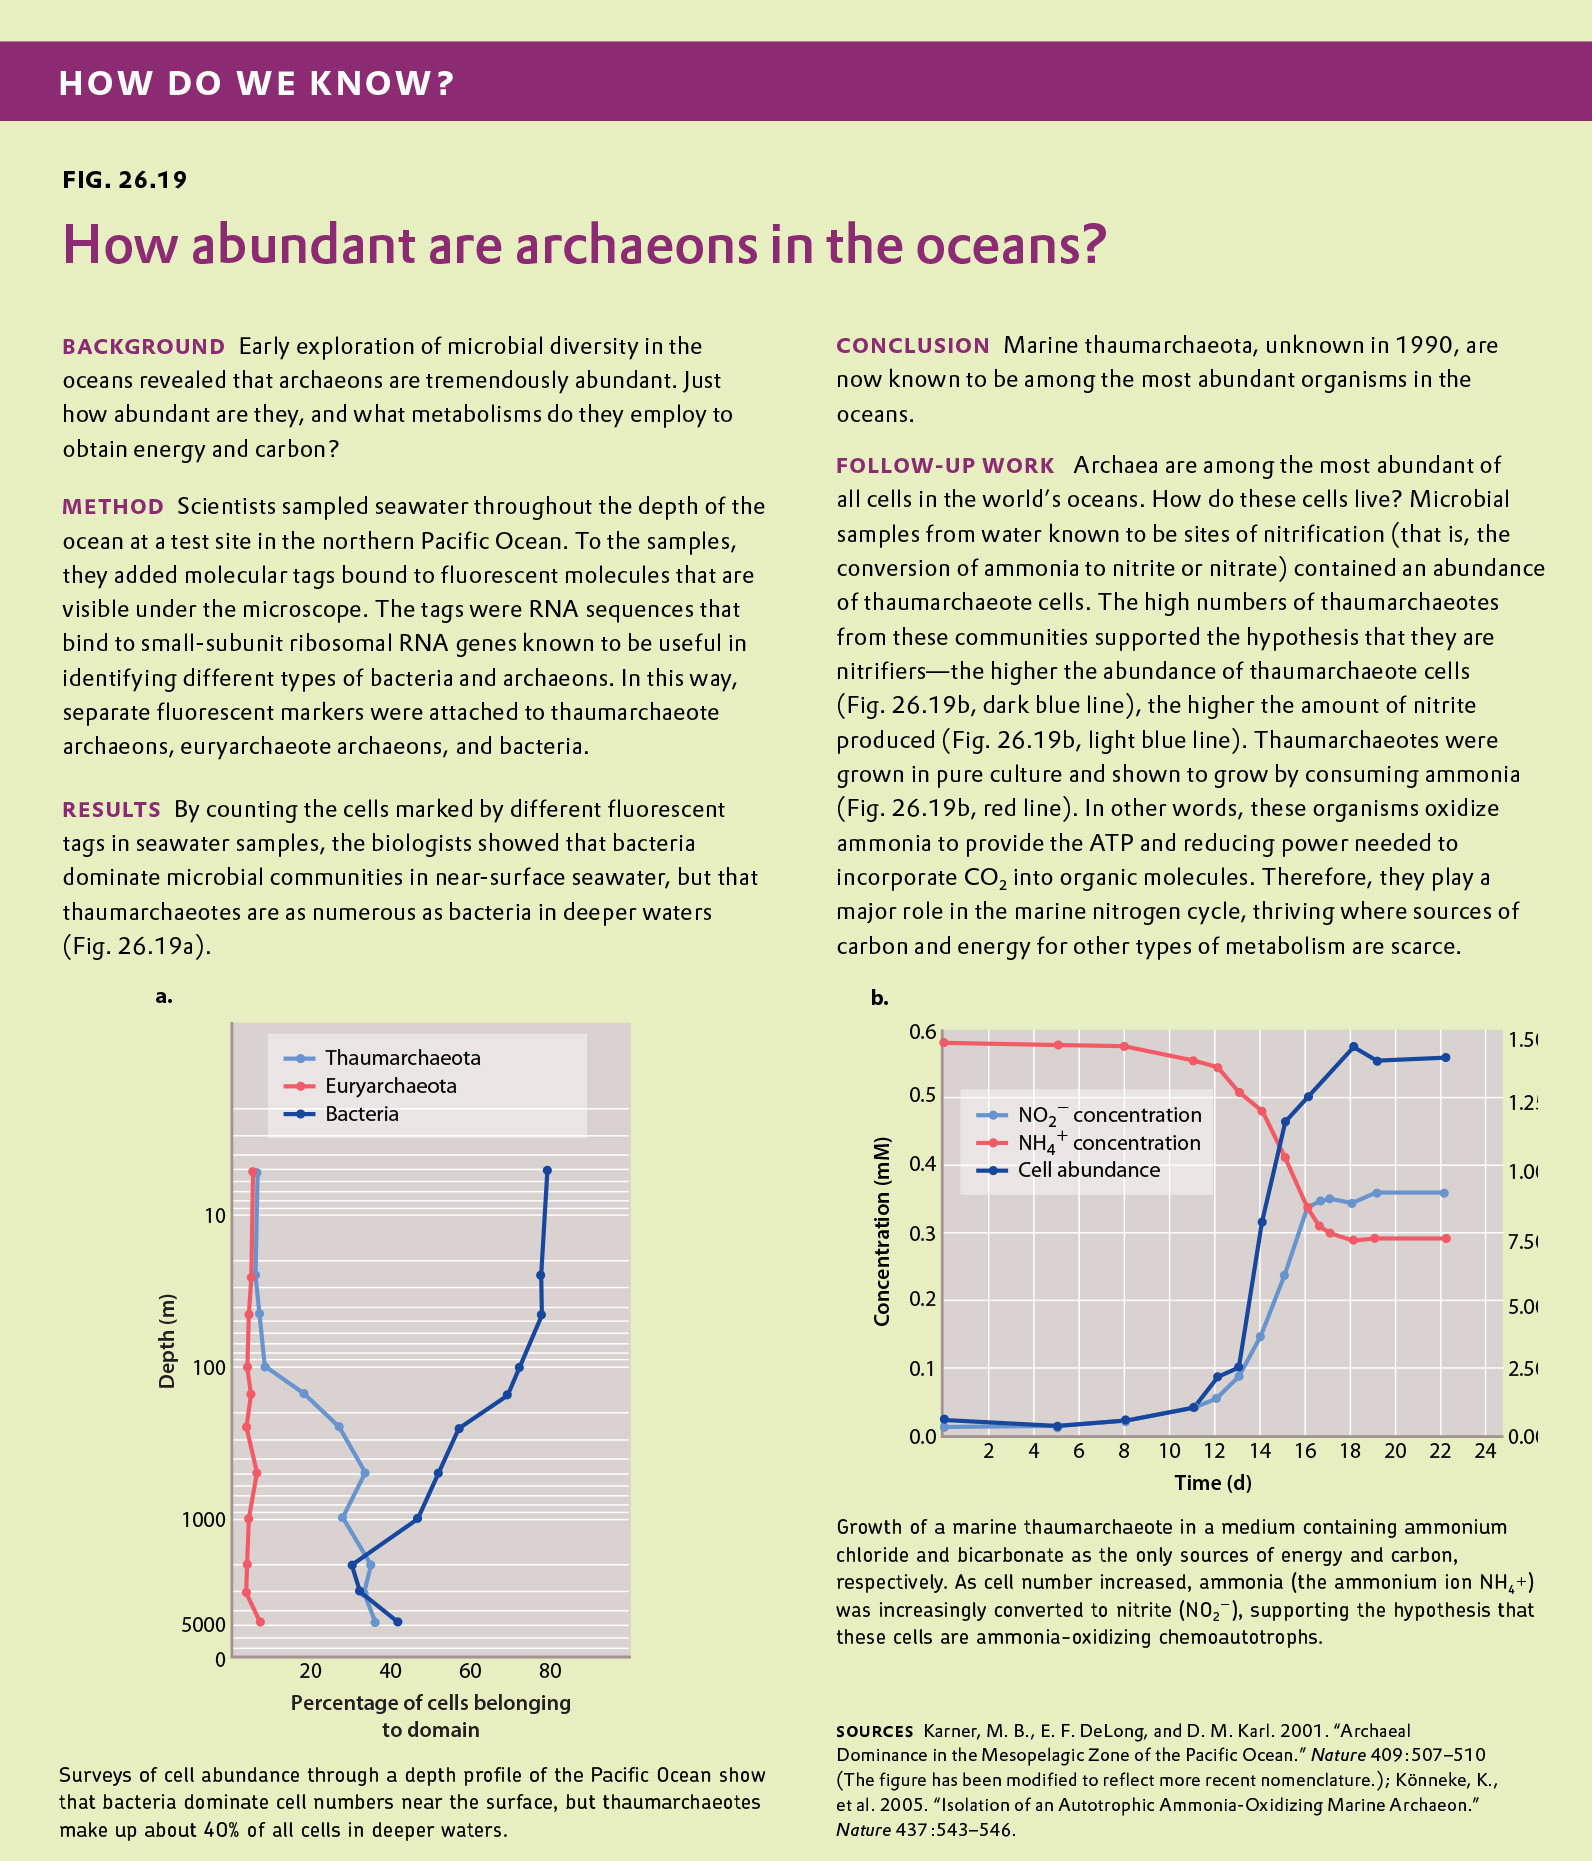
Fig. 26.19a shows depth trends in the abundance of Bacteria and two groups of Archaea in the Pacific Ocean. How would you characterize the change in abundance with increasing depth for Thaumarchaeota? (Consider whether the graph provides proportional or absolute data.)
| A. |
| B. |
| C. |
| D. |
Question
Let’s add the observation that surface waters of the ocean contain about 106 cells per cubic millimeter of seawater, while deep oceans contain approximately 104 cells per cubic millimeter. Now, how would you characterize the change in abundance with increasing depth for Thaumarchaeota?
| A. |
| B. |
| C. |
| D. |
Question
Fig. 26.19b illustrates the results of an experiment designed to test whether thaumarchaeote cells in the oceans can use nitrogen compounds in energy metabolism. How do the data support the hypothesis that these thaumarchaeotes can grow using nitrogen compounds as a source of energy?
| A. |
| B. |
| C. |
| D. |
| hypothesis | A tentative explanation for one or more observations that makes predictions that can be tested by experiments or additional observations. |
Experimental Design
Types of hypotheses
A hypothesis, as we saw in Chapter 1, is a tentative answer to the question, an expectation of what the results might be. This might at first seem counterintuitive. Science, after all, is supposed to be unbiased, so why should you expect any particular result at all? The answer is that it helps to organize the experimental setup and interpretation of the data.
Let’s consider a simple example. We design a new medicine and hypothesize that it can be used to treat headaches. This hypothesis is not just a hunch—it is based on previous observations or experiments. For example, we might observe that the chemical structure of the medicine is similar to other drugs that we already know are used to treat headaches. If we went into the experiment with no expectation at all, it would be unclear what to measure.
A hypothesis is considered tentative because we don’t know what the answer is. The answer has to wait until we conduct the experiment and look at the data. When an experiment predicts a specific effect, as in the case of the new medicine, it is typical to also state a null hypothesis, which predicts no effect. Hypotheses are never proven, but it is possible based on statistical analysis to reject a hypothesis. When a null hypothesis is rejected, the hypothesis gains support.
Sometimes, we formulate several alternative hypotheses to answer a single question. This may be the case when researchers consider different explanations of their data. Let’s say for example that we discover a protein that represses the expression of a gene. Our question might be: How does the protein repress the expression of the gene? In this case, we might come up with several models—the protein might block transcription, it might block translation, or it might interfere with the function of the protein product of the gene. Each of these models is an alternative hypothesis, one or more of which might be correct.
Question
How much ammonium was oxidized in the increase in cell abundance by an order of magnitude?
| A. |
| B. |
| C. |
| D. |
| order of magnitude | The number of times you must multiply a single digit number by ten to obtain the value in question. |
Scale and Approximation
Introduction
When a biologist does an experiment or completes a calculation, she often strives for quantitative precision. Commonly, however, it is just as important to be able to approximate – to get a ball park sense of the right answer that will rapidly help her to determine the next step in her research. One way to approximate is to make an order of magnitude comparison. Order of magnitude is commonly discussed in terms of the powers of ten – how many times you must multiply a single digit number by ten to obtain the value in question. 1492, for example, is equal to 1.492 x 1000, or 1.492 x10 x 10 x 10. The order of magnitude of 1492, then, is 3. 1620 also has an order of magnitude of 3, but the order of magnitude of 16,200 is 4:
16,200 = 1.62 × 10 × 10 × 10 × 10
Question
What is the approximate ratio between rates of ammonia depletion and nitrite increase?
| A. |
| B. |
| C. |
| D. |
Question
What if we learned that ammonium could be oxidized to nitrite at slow rates by simple chemical reaction with O2 – no metabolism involved. How would we have to modify the experiment to take this into account?
| A. |
| B. |
| C. |
| control | Operations or observations that are set up in such a way that the researcher knows in advance what result should be expected if everything in the study is working properly. |
Experimental Design
Testing Hypotheses: Controls
Hypotheses can be tested in various ways. One way is through additional observations. There are a large number of endemic species on the Galápagos Islands. We might ask why and hypothesize that it has something to do with the location of the islands relative to the mainland. To test our hypothesis, we might make additional observations. We could count the number of endemic species on many different islands, calculate the size of each of these islands, and measure the distance from the nearest mainland. From these observations, we can understand the conditions that lead to endemic species on islands.
Hypotheses can also be tested through controlled experiments. In a controlled experiment, several different groups are tested simultaneously, keeping as many variables the same among them. In one group, a single variable is changed, allowing the researcher to see if that variable has an effect on the results of the experiment. This is called the test group. In another group, the variable is not changed and no effect is expected. This group is called the negative control. Finally, in a third group, a variable is introduced that has a known effect to be sure that the experiment is working properly. This group is called the positive control.
Controls such as negative and positive control groups are operations or observations that are set up in such a way that the researcher knows in advance what result should be expected if everything in the study is working properly. Controls are performed at the same time and under the same conditions as an experiment to verify the reliability of the components of the experiment, the methods, and analysis.
For example, going back to our example of a new medicine that might be effective against headaches, you could design an experiment in which there are three groups of patients—one group receives the medicine (the test group), one group receives no medicine (the negative control group), and one group receives a medicine that is already known to be effective against headaches (the positive control group). All of the other variables, such as age, gender, and socioeconomic background, would be similar among the three groups.
These three groups help the researchers to make sense of the data. Imagine for a moment that there was just the test group with no control groups, and the headaches went away after treatment. You might conclude that the medicine alleviates headaches. But perhaps the headaches just went away on their own. The negative control group helps you to see what would happen without the medicine so you can determine which effects in the test group are due solely to the medicine.
In some cases, researchers control not just for the medicine (one group receives medicine and one does not), but also for the act of giving a medicine. In this case, one negative control involves giving no medicine, and another involves giving a placebo, which is a sugar pill with no physiological effect. In this way, the researchers control for the potential variable of taking medication. In general, for a controlled experiment, it is important to be sure that there is only one difference between the test and control groups.
Question
Let’s say we conduct another experiment to examine whether the thaumarchaeotes in the experimental culture are metabolically versatile – that is, can grow using a number of different energy sources. We remove ammonium and, instead, add hydrogen sulfide (H2S) to the experimental set-up. After 24 hours, we conclude that the thaumarchaeotes cannot grow by means of the oxidation of H2S. Describe experimental results that would lead to this conclusion:
| A. |
| B. |
| C. |
| D. |
| E. |
| F. |
| G. |