Chapter 1. Working With Data 36.20
Working with Data: HOW DO WE KNOW? Fig. 36.20
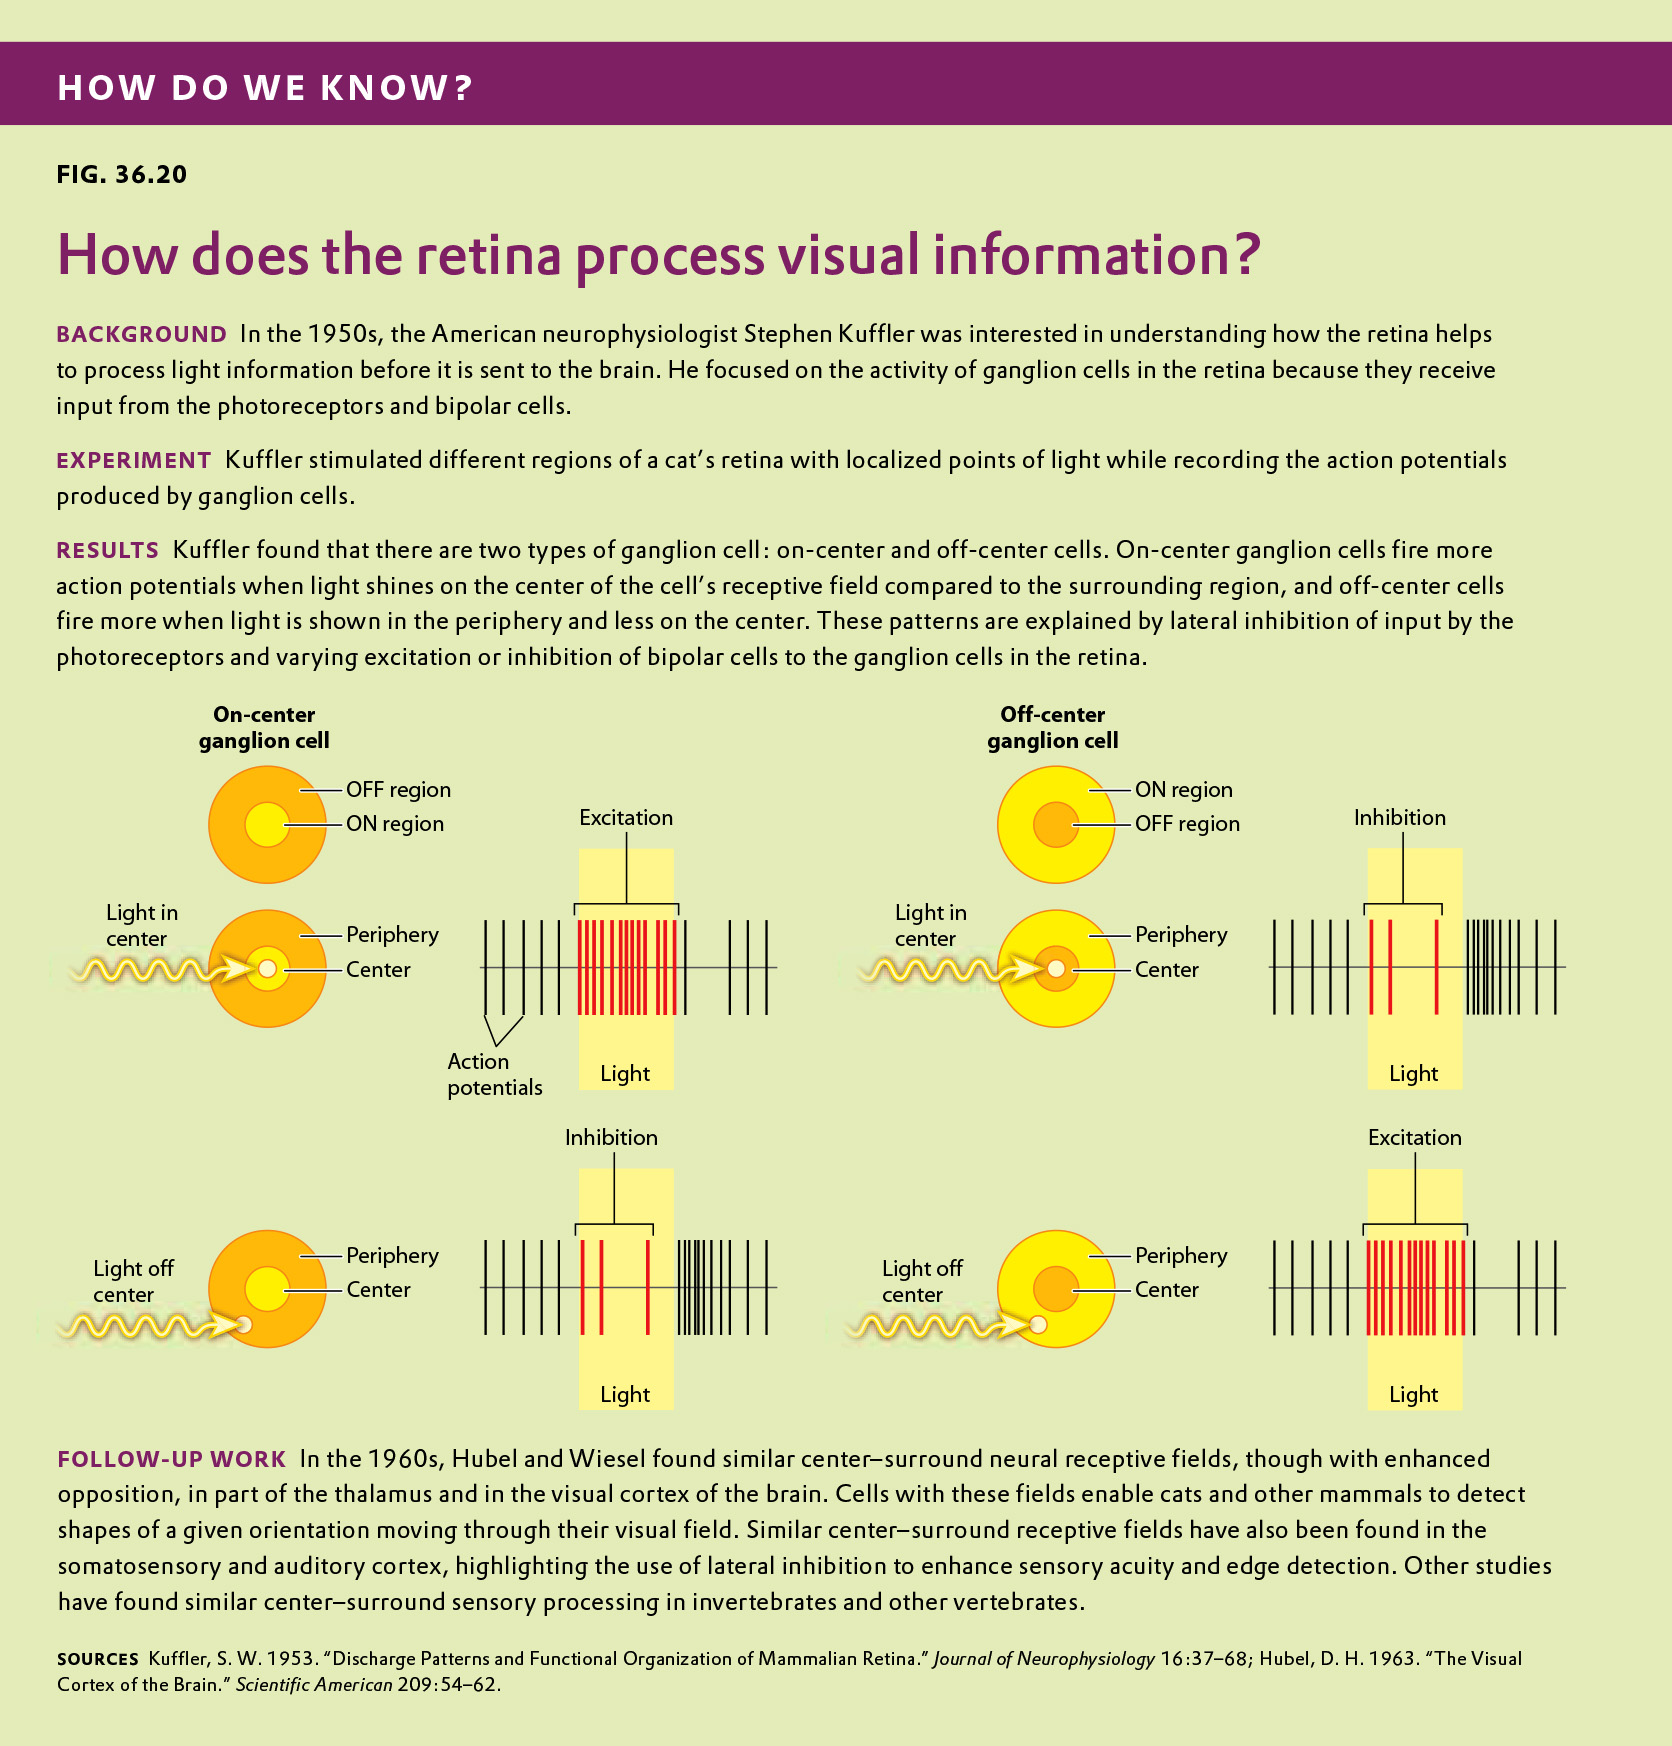
Figure 36.20 describes experiments that were conducted to understand how the retina of a mammal processes light information. Answer the questions after the figure to practice interpreting data and understanding experimental design. These questions refer to concepts that are explained in the following three brief data analysis primers from a set of four available on LaunchPad.
- Experimental Design
- Data and Data Presentation
- Statistics
You can find these primers by clicking on “Experiments and Data Analysis” in your LaunchPad menu. Within the following questions, click on “Primer Section” to read the relevant section from these primers. Click on the button labeled “Key Terms” to see pop-up definitions of boldfaced terms.
Question
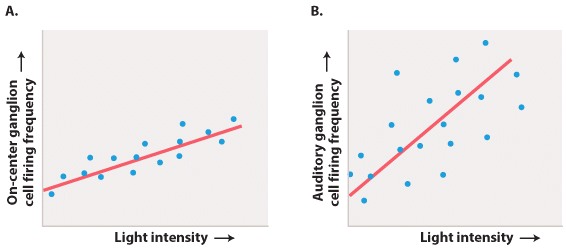
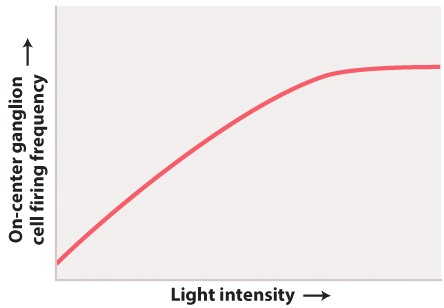
Below in Fig. 1 is a graph of the firing frequency of an “on-center” ganglion cell in response to changes in light intensity directed at the central region of its receptive field.
What is the independent variable?
| A. |
| B. |
| C. |
| D. |
| E. |
| independent variable | The manipulation performed on the test group by the researchers. |
Experimental Design
Testing Hypotheses: Variables
When performing experiments, researchers manipulate the test group differently from the control groups. This difference is known as a variable. There are two types of variables. An independent variable is the manipulation performed on the test group by the researchers. It is considered “independent” because the researchers could choose any variable they wish. The dependent variable is the effect that is being measured. It is considered “dependent” because the expectation is that it depends on the variable that was changed. In our example of the headache medicine, the independent variable is the type of medicine (new medicine, no medicine, placebo, or medicine known to be effective). The dependent variable is the presence or absence of headache following treatment.
In designing experiments, there is an additional issue to consider: the size of each of our groups. In order to draw conclusions from our data, we need to make sure that our results are valid and reproducible, and not merely the result of chance. One way to minimize the effect of chance is to include a large number of patients in each group. How many? The sample size is the number of independent data points and is determined based on probability and statistics, the subject of the next primer.