Chapter 1. Working With Data 8.12

Working with Data: HOW DO WE KNOW? Fig. 8.12

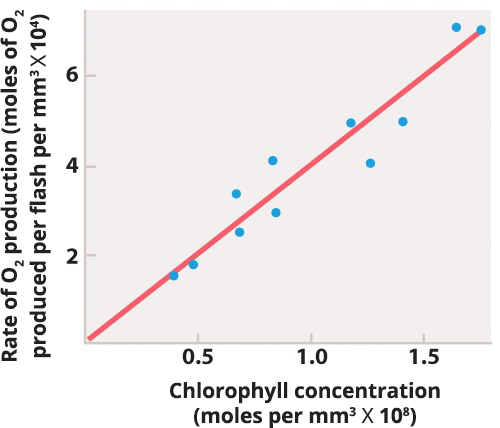
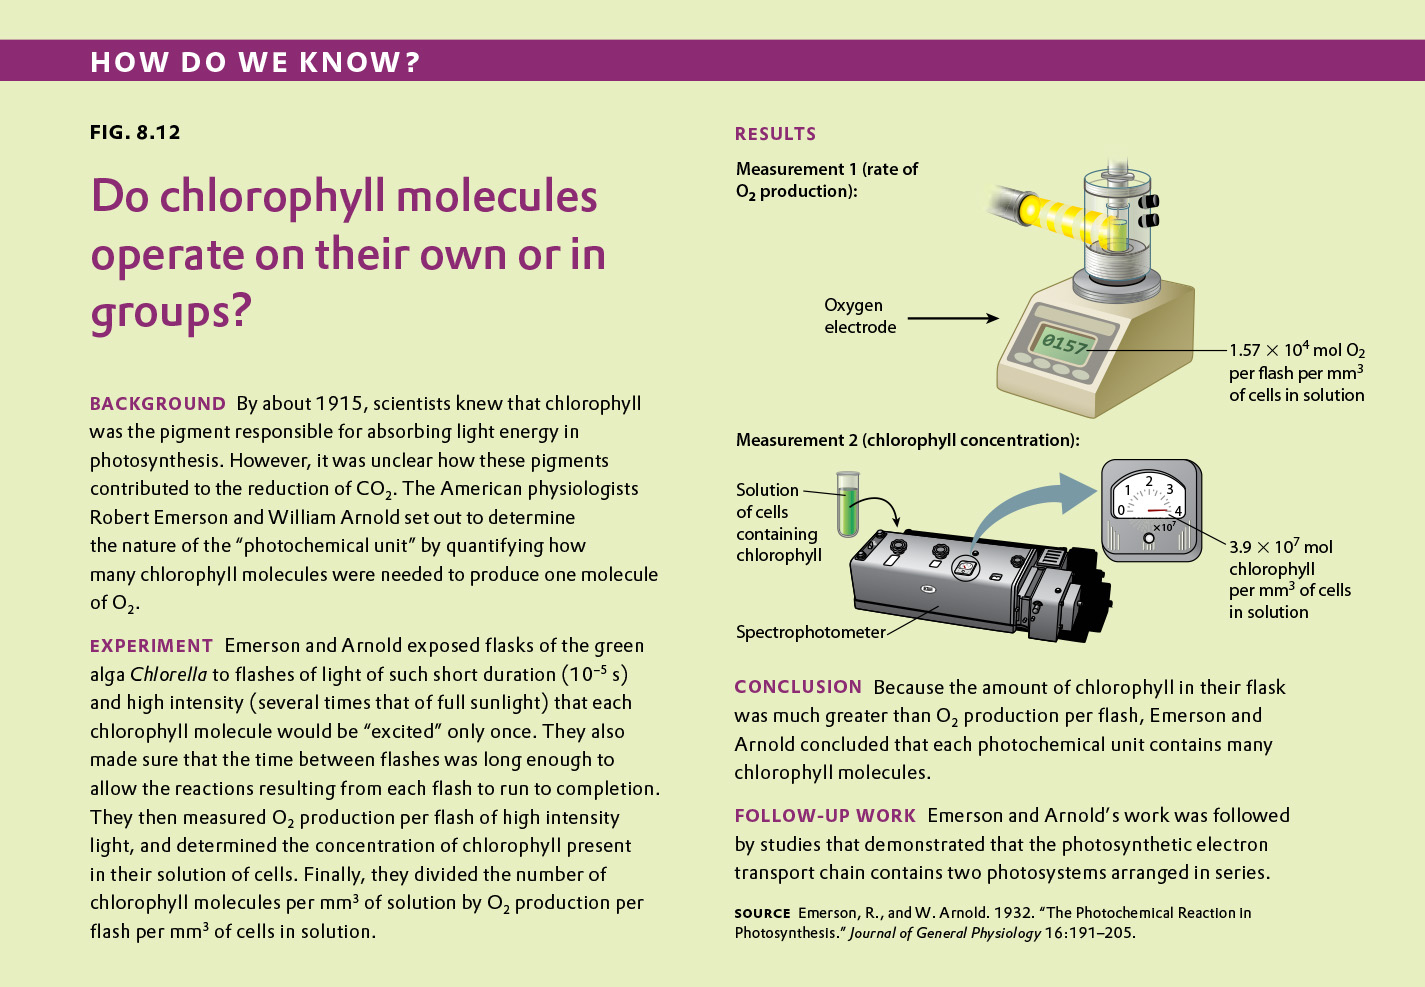
Fig. 8.12 describes experiments showing that chlorophyll molecules act in groups to transform light energy into chemical forms that can be used to produce carbohydrates from CO2 and H2O. Answer the questions after the figure to practice interpreting data and understanding experimental design. These questions refer to concepts explained in the following three brief data analysis primers from a set of four available on Launchpad:

  • Experimental Design
  • Statistics
  • Scale and Approximation

You can find these primers by clicking on “Experiments and Data Analysis” in your LaunchPad menu. Within the following questions, click on “Primer Section” to read the relevant section from these primers. Click on the button labeled “Key Terms” to see pop-up definitions of boldface terms.

Question

opUW28hRE1/TOcO4LpjWyt6Q6CnUekQxbvuLIOqR92Okp0nVDRhDXaG0rRkpNXL3z49MPBkXf9tcqN4MG4CCAN1vgUU1MKkd+BqO/YEiQno6osfPXpufWZYLJIqesEO/fngFGADjv+9qcbOqRv08RKxrFetAs1XThPluHVJlhLw0AWVcdr4dhi+A63y0d3kRY9u8KDZKty802MmrJKnZtQyGryQSzVFDv9YJKlvvYLzDsGejVI/vewgPPZOO6sFkBrikAlsyVzlWzj3jbXV0+auqcwp6WjXXUaVXrwcH6kX8zYaLkhpDxNsh3gvv08Xyvi0MdlHPKzIeTdb/G7ZzwTIIqqNLsgqxY3fs/an2XvqEyvo6xJzZQm2C5xo61VaWSjcvHzQ9LwDyyCQE1WMqsVuzHnWKJA2ato+ozhF7TnyD1DhsVGvMRA78tdoALxDXnCJx0P26mju9rvPAgMNeNL6zluVenVFwbAEIQG7WAdOYx0EGDR7cA7921htcx+AVTIV7ZMeb1RhRde1WIt8/1lGeBSoTezvUI3wb4sosPieehWMAkDNGV3lEAiBmxZY+Jb5vNN6S9b3iZkEymXY/TgKXNrEXmh4e/dNFihS1ANq/0nSTWMdpwmrJk5c0qzEqirUDvZFmQiCs049ZaET6TkoKC9EZC+2NDp80lYaN8yMY0R/TTJMj9coBeqiik/l14DSgmuSuP2ULUJgUG7mY2GaJin35iD73+sBgn8UOqNyyjn1rAGv9MSUZAF7AUcOIXI3SoPPOZUvO4TU+CwN7Pi9hVnEPAQ+FFqLzcE950hW0dW3emSpQ/MSYevadu0KV+4XJnkdxcRJU84dj9rpBcZouGrpW52I4obgtL8K4uwz08/pvZjfGkwYNXGo7PtN3GlQzvK0ZIlEzBScsixtUmML5Plz9fC66Eo+8tFnTglslE0xbUe87E9Ur20YFA6uLGwRf0kfuH7V+JLAeT662rV2slDA/ADM6byQUPuyeE224oOPqwUY/M2GWMlDplK02Ejj4CqNaEJ7VN7Vk0rS9CX51LH5/7/iSi60R1b2cg0VPuVtNgITXXU2W/vLbQUmWIAmpy6GUqNfC8qKrGeXYe8Q1gYhPLN3bU/FQ4hhjgiIrIkAMKKkdq2scbQjreg91c4doGSdvIqWMOEOqgQODJHtDH6QzQW/Cx75qY9twpHXft2dkROuVfMsvvSxYJWqD2MmkQwKUpWgPtSA+DiOKD8/k4KI2aK5cHlAjfHKjvq0kPgx+jQdZ5dr10dv5zR4/wXrsF55cAtMr4MbYfjwqkBGBvFphxYXgKoqw5BfVjpqsU6WLLxxebs8tHmrA12AICbRbtuoU0ThOWHeay9pPP40rw+Q/8QX+/p3XppRPzw7x/Rn4APHqEJGVaaDs0mM5Sg3dqEUQ9dRmZ+yIuKwh7pKLuXFebOrpeU0/50GdYfUNzRC7CUtlGEy1xNxPMyNEDitmWEtnusgd66Zp7Sz7URMxBHyQlIPfCmMdAK1mXxtd/s1JaHuAFL/1JisGd+y3BNoxHi9fQ+JAdSZnjptGZSyb0AvSqpMdSHtf2C3EyqQ=
Correct.
Incorrect.
Incorrect. Please try again.
1

order of magnitude The number of times you must multiply a single digit number by ten to obtain the value in question.
Table

Scale and Approximation

When a biologist does an experiment or completes a calculation, she often strives for quantitative precision. Commonly, however, it is just as important to be able to approximate – to get a ball park sense of the right answer that will rapidly help her to determine the next step in her research. One way to approximate is to make an order of magnitude comparison. Order of magnitude is commonly discussed in terms of the powers of ten – how many times you must multiply a single digit number by ten to obtain the value in question. 1492, for example, is equal to 1.492 x 1000, or 1.492 x 10 x 10 x 10. The order of magnitude of 1492, then, is 3. 1620 also has an order of magnitude of 3, but the order of magnitude of 16,200 is 4:

16,200 = 1.62 x 10 x 10 x 10 x 10

Exponents and Order of Magnitude

Order of magnitude is most easily evaluated when numbers are presented in what is commonly called scientific notation: a number between one and ten is multiplied by ten by a number of times indicated by a small superscript called the exponent.

1492 = 1.492 x 10³

16,200 = 1.62 x 10⁴

Exponents also enable us to approximate the ratio of two numbers. We simply subtract one exponent from the other:

16,200/1492 = (1.62 x 10⁴)/(1.492 x 103)

= 1.62 x 10(4−3)/1.492

= (1.62/1.492) x 101

In many cases, we’ll want to know that the exact value of this ratio is 10.86, but as an approximation, exponents tell us that the larger number is an order of magnitude greater than the smaller.

Question

lEDKTNi3z+JdOLQU9ggWYKWgXtCv2u0wGsxVoeTYSVNlt5cmrqmIJUhKjb7wMmZCR7rU89+od0R2szAnIHxJHeF/dG/yCcIBdaBJcv919J1PUElTpZuIoPhcfBvy5+WvPgDY/OinVi+8WSswf2Fo6/PKJTDR/eTuR6VLy4+/qUo0UGZ6V0SLk/l3+1NKv4Iq/kWwFeLWlxupYzdfwQ9Fcc0d6AhZnT/xE8oUOEF1mqxVrsvxwp7QTKaFoxknCcwPZkiJ0bqFj14pLjfCrJ7LmpP4tQOk4U5fkFl02zUt+CL6U8rnR7Xdk03JW8DMNqDZgtO1XKKFax+Y5U2wXCiCefhiZiGxSSJJ70i2DOtuhzZ5jQ8MMsn7QfMpg1MxGyj8cEnqs19cFzG+lMpIH/cz9v6XRKDefU7o1aPMoYVuLcNoMIIEfxYUjBGSs8hkSfLyFMnOgjC0CwGkU5RpCoYQ6eINlQIO4jTxlqSPbkXovSqCP6t4lA2nTMnBNguNKxtAdRRMM9R9ilAqXcq1cGNYMFH0Inz2hjE/vBxuqfkjmpe6p8ss52GJbgPNuTmMpGMDbNqJ1KBcNkBSruAC0JyjYJZ0eeky2+BQ/0aR+X6E9EU5Ck8JCinqgnU7LYz8sYUb76OsmoNt8qKIrgkm+C/0Of48USQh5KLe6Ug5DYIcUMlpHZjd4L8FSFQKwYVPiaQJ/56t0aIQX9q90Ni62tJ6yu3zrlRr2cEyJyAZ+7fztOFdb8oWyTtPU93mBNjuTiBWGdN1iqt0kjJhG1g2e52CzYTdzNaN0cejxtb29s7tVppB6BYOLFTu0qhntDhR9MVgo3dyabzCRLqmeVZ+bxnr6K4saq+1Hatv9LAJha4NaDElFe4OP+GeJEAf1Xx4tqd3DbupDRgr34OegTGkZ2wIez3HLsaMM1TjT9n7pYlUOfKpNMmShu9UFevJYmzILiA5pYnlEKByxlTM4NO1HDM85cMiEQ7aZfPH8oBPAmD6FhLmYyYhvkF67J7aRrWCcKcCNOjblmjQfNjkW/fleX6C4Jvc1DnCz5tJ5QITNalHIHTCGk1V8eoI4lL9NGkfBmsaKSg7jyBHfBWEkuZWynAq4gTZNCvA/FEQMHC7/8dT/VhimQ7n0WO+de6gcBidqWh0pVLiYICDbmUGDsiOvKUj4cz+SgHdg5huMwgpUmYF/dnZvX615/WXCarIDvlcEDLrBIXVH/gFIhYsPbNR3VKIi8kffRnw6xLFx3HCPBRNzIrsb460fSfHnF4A9swUCs9vWT24EbZt9FZyuPgOXzaeq1T9e6g4ykCqzz7TgucDQn4xbjY7fyfcyRlJ44q0cSVTQz7MNBSohQu+DhW0
Correct.
Incorrect.
Incorrect. Please try again.
1

exponent A superscript that indicates the number of times a number is to be multiplied by itself.
Table

Scale and Approximation

Exponents and Order of Magnitude

Order of magnitude is most easily evaluated when numbers are presented in what is commonly called scientific notation: a number between one and ten is multiplied by ten by a number of times indicated by a small superscript called the exponent.

1492 = 1.492 x 10³

16,200 = 1.62 x 10⁴

Exponents also enable us to approximate the ratio of two numbers. We simply subtract one exponent from the other:

16,200/1492 = (1.62 x 10⁴)/(1.492 x 103)

= 1.62 x 10(4−3)/1.492

= (1.62/1.492) x 101

In many cases, we’ll want to know that the exact value of this ratio is 10.86, but as an approximation, exponents tell us that the larger number is an order of magnitude greater than the smaller.

Question

thIqG5GZGGtIojLr/sYLWuaNL5uRQlMvjBAciv2iup4FzMY16Rv/vyARQUExPGCwanFZirnJq7K+84rcheIMl+rpyZglJaYZc5XHARrjtP22AHHEVvlimMiUoiBkOhI55hZVx2V9ZtldB8x/SvoluqspSVFCl4XY/0LB3PBMIkSaiU337cFzNlv5cU4oL1OIlXx4cX7vaQxZAsujTQz1uWB0/skZZ2X5sRNOKvYQ1bvRpry/DkF+Xl3poU42rpXTlVlNzFyuvkmGt5jkUXdrnPt/wRUndu1zpbJwKuMsQswa/3O1E7xA8xo64gNX7x7LAtpe+/EBZ2ieiMvJIxlIg58iTnuYxOA06VxYtePaMb+GCETIFGcjwU2G14seVsEQT6z6Nmv/2AYRjFvh9OfZIzTbwCkUGS0PhOdBU8HDClSYC+XtX/V0+o1nKRf3JQ7/FMl8b8JKDOJZDjLdXRD4kUKB1/+4l6fGZjc83/Vg70OaqxuUDw2KNqXcCzkFyJIBTDKYxKnAwvFnOB4f+yuIOg3dv3FuLiIYjWWoOiNhMZnK1yFPaIzSQ9qAA9EZ/IhQA9ke/TrVAZBOscikA3l5Eisye9Z9oDMklx8A/E8d6uuzkbh5Q24VE5g/t+dZxsYYQJrrtpcxdcsndMiRTNTZlyUJAdzx4CByXRE3gO5nrhlGUY+0bSFwQ+BILIAl655tS9ElvmrC0dsFidyq1FDPMcHzMhCk0I3BrWuaCqM7jSJea4z1aExVs7FenrxF5N7Rl9jHnCdiIRWKJFoZ7YfJ1q3cO+YR/DGYfntQfHUVE6RFkMF36jUQr9hXxTJkDLWflJO70f2M3PnHnP4TyADPhHO1MKjYIZI968ZQsaQ2UZ5NmMRmkdCuYLcLRdStM+jKDLvD6+Na/cCQzYPllrJDfvqcKXYIK0N2L7lhrfTMd/KaRIMMm6eY8cUPBuFwxrmdhOHbpex0uyKy0E9pHA0HR6CPSzJMxByRXLWTDclPxi3s1+fqBQ4c0gJlwx8oCzf3cuv7qoRHsUSBJJc+FmzMmiCEmTqnkl6CwVr+LHTE3Wxj6DozggBQRLbP/FYwtPqzILdiUeKXN6DJNSz4t2XO4AfZdBDP7BdlJtz1JyaKRbdfj3JXhKz7770bcenlkZgc9xMEudHq6+U=
Correct.
Incorrect.
Incorrect. Please try again.
1

positive correlation An association between variables such that as one variable increases, the other increases.
negative correlation An association between variables such that as one variable increases, the other decreases.
normal distribution The smooth, bell-shaped curve expected from the cumulative effects of many independent factors affecting the quantity being measured.
Table

Statistics

Correlation and Regression

Biologists often are also interested in the relation between two different measurements, such as height and weight or number of species on an island versus the size of the island. Such data are often depicted as a scatter plot (Figure 5), in which the magnitude of one variable is plotted along the x-axis and the other along the y-axis, each point representing one paired observation.

Figures 5a and 5b

Figure 5A is the sort of data that would correspond to fingerprint ridge count (the number of raised skin ridges lying between two reference points in each fingerprint). While the data show some scatter, the overall trend is evident. There is a very strong association between the average fingerprint ridge count of parents and that of their offspring. The strength of association between two variables can be measured by the correlation coefficient, which theoretically ranges between +1 and –1. A correlation coefficient of +1 means a perfect positive relation (as one variable increases, the other increases proportionally), and a correlation coefficient of –1 implies a perfect negative relation (as one variable increases, the other decreases proportionally). Correlation coefficients of +1 or –1 are rarely observed in real data. In the case of fingerprint ridge count, the correlation coefficient is 0.9, which implies that the average fingerprint ridge count of offspring is almost (but not quite) equal to that of the parents. For a complex trait, this is a remarkably strong correlation.

Figure 5B represents data that would correspond to adult height. The data exhibit greater scatter than in Figure 5A; however, there is still a fairly strong resemblance between parents and offspring. The correlation coefficient in this case is 0.5. This value means that, on average, the offspring height is approximately halfway between that of the average of the parents and the average of the population as a whole.

The illustrations in Figure 5A and 5B also emphasize one limitation of the correlation coefficient. The correlation coefficient measures the strength of a straight-line (linear) relation. A nonlinear relation (one curving upward or downward) between two variables could be quite strong, but the data might still show a weak correlation.

Each of the straight lines in Figure 5 is a regression line or, more precisely, a regression line of y on x. Each line depicts how, on average, the variable y changes as a function of the variable x across the whole set of data. The slope of the line tells you how many units y changes, on average, for a unit change in x. A slope of +1 implies that a one-unit change in x results in a one-unit change in y, and a slope of 0 implies that the value of x has no effect on the value of y. The slope of a straight line relating values of y to those of x is known as the regression coefficient.

Question

rzoszPiiiI78XiHQOrv0WKjyqNnww8HoydRycU9pji+AmGau9TG5YIH3Tjpe8LzCg7RJsnf6+TmfqL0N2SRF8eqprWzbs8efPv+2Nk4sWONu7p2BgD5p0a6YePzKUpLY4KuodBArmEMDWe8GipT+gvm3ukTNsfRML9kkXCxbIlV+pVRxIRulYLbFBvL52bkWDqbBAz5OY67OU/tDk4y7WoE9GTUVCuN/OBb0YiLqVLsOoOrvMa1cTOTmvYx9gwOKqj3gqbw3VmlrSEXXf0sXGi4Tsn50xHcd/vZssoa3dWucfl4Yp4zK5qOueIOqt+Pter/wFY3DiSer7psiewOuj6qS8HwEtq51WQM7aIKiMcdqMtRzSfHK9jVRwCqwt0SPq6bYxxh++wFqPhjsvdiSMNpOHicJo8tK4/FEi61ZB4NbApTwLbOdkioAciAnIs8iveNxCndWs0dI35S6j3+K6hbsa8B4z7J34VRXt0baeDNVKGkSDNi9iPPUbO6zDijtOHy1fDeSvzD/O01WqOztLKVmjex8VpQ3vk7eA9vhvj2bm1Yz/fKKIeeGhJl3P2PzIpvUkP7rp4OllXhJ2ewWkgH5GWsdGS2SoeX4l02K/OJLGG4O9qMVyPsmVq1olQaDcM/bQ5nIopC+JXtpwo1It5zFnk7xBYtmnp5CEwrgx9t6C8KuEqkn3zUn/T+gEa7ISMMxvOYyEwaznHiA3fEaPVXSR9DOFc/EOI/3HxV1amy0XBevVoILu/sk2zel6FdM2m6+Qouz1ELOSTAiwu2SrjBQSPi59BPbB9jUj2ji7TdikGp0bvHNrjMtD0Kudgvby1+AJV28XjxnwUWzN/0faE/bwJB4kmmdPAC4RcX1TlXCRgHGDCSSBzuYouKy0B+WiQ/SU9cceLnOvY2Ub/Lry/rShB9LjN2VcltyrPJqkw+NZLTi5PhT0nIn3yKCTq7NT/sFGRYWmCsfE/K1DHr+yWzD2XorSB7DD4tet29gvELISHCWrHajYBDlmu/DAhgjrjg0YwWG8eC4d1Wgf8FUSnTaY76E1SE++AAPNS0eKPNFgvBXr0C5rXaUfuqm4aWpAMqAUrlArIhsp52vRUNgh2KX/gI4Yr7BcjeXyVXE8fUmQ4piM99LiZlOevn6rcpuAkFEmjOC0EYVL/UUIFOCFD5soGv5PPDSpTlMSTM30aYjXYWvk/ZOBvv5QGQULhdvZ4JImmhkWfRQ0PTI
Correct.
Incorrect.
Incorrect. Please try again.
1

variable A quantity, feature, or factor that can change or be changed.
independent variable The manipulation performed on the test group by the researchers.
dependent variable The effect that is being measured.
Table

Experimental Design

Testing Hypotheses: Variables

When performing experiments, researchers manipulate the test group differently from the control groups. This difference is known as a variable. There are two types of variables. An independent variable is the manipulation performed on the test group by the researchers. It is considered “independent” because the researchers could choose any variable they wish. The dependent variable is the effect that is being measured. It is considered “dependent” because the expectation is that it depends on the variable that was changed. In our example of the headache medicine, the independent variable is the type of medicine (new medicine, no medicine, placebo, or medicine known to be effective). The dependent variable is the presence or absence of headache following treatment.

Question

apmXWnxdRJlb3eAObnGwT6Ktch78K6Ouxz/ZNvHzKMgl3tijgcxLSVimM1PE9DT7yG6ErKEO+as2zctvOTw6vFsIAlj22u7v7JyKhg7y6QUPN0DrMdPuchWBilAIUnB1/TkAdMivANEaZipTIBIzF4h3NHImBtwWQ1vokFKkpqP5XcaHmgSj+aQIJVoFtJIjUiYur/uwAQwI9nqEJ1S1NJ8Ue24vBikwMM95YfZvE9ojskKhIKl3XG6H9Yplt67D0F8CGkDHpekplmyqCR0j0lhnrxgqnNZ5OneQOpA2ETK3qZDmqmL/941Ifh6m0KmgM3YbYw6qtLuN4m+kFvfxPnKHt0CpDtL/N1I8bpFl2rczbUimoniVszvVTXqiAwNd24e2/y9h48mVOs3/oVHXua/LjZpmk+nKRwBAiiL5gy3fyDEhLZBMPZFM/+UnCnJCh0njHbM23UeE4/KM2RwT007+Q8lFWyBjXx3zEhKAvTeX0XYzPWfpjnI6x4Gwv7bSUn0AaFjxy20XoYo1Tbma/KWpTRSDS8O+kf7gRCqGFnrIwuREgz3+2E+vn6br1LI8jWUE5VHWM8ipGh+PIg7UcKag+ajmF83NeJ+YTaaRJOF8bm5RShMOD36N+CmT2ifbWMQl2cOZoOItdKBLuZDhY/4UoHx//dSczYmGF9JyStQzOiCaMOylEJIxRZtiDMwWAwO9UXr30Iipw83nucq6OOEAnvBxSykzod1BY/aWjbwNtBjubgM5KlmxC5k1WgkWHTvJYYtSJJ8c9GeRddt17cMg2y8JQ+ArneAPWzPAI9jRXKQCccGQuv0edu+ivc9+YUKw4qYLLAAKhxMAcmsA3TDdL4zQJhQ8CaZxd3JCoYiny5JdyXeE3IosWnITU7PrJIbdZ1TvZ1q1VKSDJCnUWPumjezXF7dzm16HPy3FzfgAPcBIKVG5HQekboAqyEXRhQAIvuRLnSEEF1xP4u8PhxmsPDLLOh7zRB9j0VN0UR4qgfOBIuvZS7bKcEviGFhJv3eqlA2unkvrHL4nzcY5ACeZxaPbvPVyRtS3XbJnupwuBeZzlFEkwTv3QOzH1PDi4MU/6alxTSsAjcm4KeBVfwVNq3RgVFdfk8mhLpI+VbwqtKu74mqIkwd5r6Me8PEONYYmMVojT1fa6ex41rX/CY5wEMiKicv9QLeF/nGY8+QNJkHTfooUh1DBOsaLO+tLwB0aj0tGonRWVWXA+2lzoo03XRLDEao2nLO1Ly1AINEziuwT
Correct.
Incorrect.
Incorrect. Please try again.
1

Question

FKIAh/CWs09g9bvNFYtxhyGBgrWkk6Hvu43KVJR0tuZyDiUZJOnShTFpkyNEL35QucOPsjJwW2gFDEKHaiLrhlCF2igvnY7osp3Xlid2DPQH//lHK08B5Yc9OQHMqXkY4lpsUwhUyGsPlfzgsX8pxxfkDPdeVeHFvmcB4H3DFU4xZytgItUYzLfgQJsKigwSi+4zF6aR2J2CI+7DvzH9HVX9byawUkLJaHwxqDRYpRnqhd6yNdC+WYbPaBOUs16zrRmLqCdHUCs7PX2YF0UCORgiTulPJwmWbg8ShAFhh7PUr2szjQbuFzM605DXIZr391nfTZbVPvjxp0ugwCb8mtNelIyXaB3oikbsGD0np1tjuW/Ba3MgbZjWS7CfnlSIA5qq48CdK/N68IJnEKEdF26i6YT4bh+d7EljR1RgA5+V4iXuMpDlZX32sAywvSzn8Rlz1sNo6N6n+w4JhyAt9BOr5ukk+2AkwgH58fqykhtQZdWmeVWDd9hEMbcxBE96B1tFUJKxFnOSZALBbnWFNdNUB7xVMEXj6YF7e2VDTnpAROsBMnc8U5JsIsAfMhc/tuzolq1AdSc0wW7yWACXGkk6mvH315fSOyZUdw/VJNNSITRh4ZrljgKbbdU03uP/25kZ3DlMQeW3gBlIiyqmezf9SPex3M6BkPP64cIda/LCOS+vdT0wf5n09hZLdb/HhvaxAPld8LsDjRViRxs4h5/m6kBP9VdqvqTAYLCgN6niUJ4BNq6ISaX0BU/KOKlO4GB9uX9MGn+YfpbtTKSQNzbaXjoknYp3CNv5I6hlEAYTQvwsztNUUuN5t14v4+IfEoyFOWWtKqj5DalwWUWb1wFkIj8Bq4+0gLyFDKrIP4+qXnZopPMeMn6SilEeH1PLgcuZgZ3Cq40Tt8ktffomc7fyjxEffyL2HsTcGDD4p8Sop3Zyxm5W7IRQJJ/8cuPMDjy/kPlUoTkt34q5NUDMTPpo9G/XxioLVIfeQALpvoiMhcvjEKvS4J3+aXheulechmAZK0h8P2ES+TnhB3ILGoXtF8zARFLu9UgiNibnnVWX1+UD6gyyrH1V/U76xG+Gj+mWT6nOZ8pWZtNVoyXtlxbT6XjF44erh3iWS+Fu3zpU84MWQQfajNrV5GEkAGsOrLOl8MmgA/TYC33L+c3f7eEzRUFcx3GPjQX/jnrNpb0sfvom2kZBkFgOsBsTDAlsukKz74v7pxY+6BBWrf7fGlZb1dFsnmFzbKwT19FXisEOzG/8zaq19gJvChOHPNLiLRgZ6GcCZM5EWxQ3jBbF7BDp+iv5m72WIaO+Pwhim07WUZYMRj6v71cewh44xHBs7xDEcEkAA2tZm3bePHKjxe/tqkA0LiK4inUxLNK0jPXcYWFDbEOf9Rmp19p1/BvC5ehEnwM5WyMTI9Fab2N6QCXvuGHiwQ71K6+wSz6gY0L0HQVofnOh4I0hBjyQPgbIAcluD7ug/51Ee2xkonxdUtYTN3wQXBXj054eSl24syDlxeL3mvuk+dNfi+CzVbaa6Ehrb5FmI31cPj0Gr2UrJfC9Etl5sqq1DeCxnyqHtZolUw+znY/IB+fGMTibJQEyAAATXs4LPVCzyZai2VZIG2zgHsMbFckQwv7EwFCewOXf9OBz8wCsJgFTGL7p+kGKr0uNAGdyivpP/ItfjBhwlbWKKqWkPapxFC05+w9hUG4HEYjBJASPs31VCnlEWlsumN0y+9MrtmdSPM2lUZDoEDIn3QJdqTLZ5UC+a9wDh8aeOPqeHJzEqeoN5HM1U1O66+aXAMB4Iksc1pUmss1oh5mD2G1zyYkJ03RYCYgF7xzRwuQaXaRbCwY3OttnT2I+fo0m3Whkk5t9na8gnlH65bBczVOuNkwpEmXZPkEZ1HTVHDbozc7eb3Ctb6xLqk0HTqUnKpjdXNjPvPLVg3ywySpx1Hfdnn7Xj7NTz2kxDHxHHMkwSmS66nNLGx16+LatqujyMxO+tNyrJIN/50yJpclhhx3XaZHnQZHG5ia83bkkA7oG2Ler2NuyBYsKq7tu7l1mG7l/KFDw4SksMU/zQFceb1LbB/DmVlXQ6A==
Correct.
Incorrect.
Incorrect. Please try again.
1

null hypothesis A hypothesis that is to be tested, often one that predicts no effect.
Table

Experimental Design

Experiments provide one way to make sense of the world. There are many different kinds of experiments, some of which begin with observations. Charles Darwin began with all kinds of observations—the relationship between living organisms and fossils, the distribution of organisms on the Earth, species found on islands and nowhere else—and inferred an evolutionary process to explain what he saw. Other experiments begin with data collection. For example, genome studies begin by collecting vast amounts of data—the sequence of nucleotides in all of the DNA of an organism—and then ask questions about the patterns that are found.

Such observations can lead to questions – Why are organisms adapted to their environment? Why are there so many endemic species (organisms found in one place and nowhere else) on islands? Why does the human genome contain vast stretches of DNA that do not code for protein?

Types of hypotheses

A hypothesis, as we saw in Chapter 1, is a tentative answer to the question, an expectation of what the results might be. This might at first seem counterintuitive. Science, after all, is supposed to be unbiased, so why should you expect any particular result at all? The answer is that it helps to organize the experimental setup and interpretation of the data.

Let’s consider a simple example. We design a new medicine and hypothesize that it can be used to treat headaches. This hypothesis is not just a hunch—it is based on previous observations or experiments. For example, we might observe that the chemical structure of the medicine is similar to other drugs that we already know are used to treat headaches. If we went into the experiment with no expectation at all, it would be unclear what to measure.

A hypothesis is considered tentative because we don’t know what the answer is. The answer has to wait until we conduct the experiment and look at the data. When an experiment predicts a specific effect, as in the case of the new medicine, it is typical to also state a null hypothesis, which predicts no effect. Hypotheses are never proven, but it is possible based on statistical analysis to reject a hypothesis. When a null hypothesis is rejected, the hypothesis gains support.

Sometimes, we formulate several alternative hypotheses to answer a single question. This may be the case when researchers consider different explanations of their data. Let’s say for example that we discover a protein that represses the expression of a gene. Our question might be: How does the protein repress the expression of the gene? In this case, we might come up with several models—the protein might block transcription, it might block translation, or it might interfere with the function of the protein product of the gene. Each of these models is an alternative hypothesis, one or more of which might be correct.

Question

qlmxDs4JeTXiDb20hywCIKINdLbklRihsHl8ZYAw1jfxsI9NYTfW2MZN76YU+u3gDnx9eS/nRCY7kudaEW0GLEUDMCg4dk//ylIcV0MKNAI8kb+qOrakO42uh568eKI5io0B/Gug7G2sbLymP0ffbi6YGJ/pZlkM3WR99OUIUevOdM9vd6XpbN09qVXQHXNhOdkvIdUwMn/23+GyGsDsT8e3s+alM7UU0UscN9jBY8lhlPJHpt1K2aRSFYohfbNi/e45SIxYXezHnZlZzoxys7+s/D3480GXT8NxrDLCXTfDXO5rDxn64jpAnVmkmephvwp3veIUwxcinFsZBFcWv0Yg2B9JzgD0OLNLWUtS3DfbTU+YvHj/B07FNyXsOaFnweVrw6K9hZ8kizICJlJCRaPfa11t7WFUlZX5ZMVV3R0/AM803BtULxTYQ4g0yEpjmoOdoLQCqoa7rVh4VWy+0anuCbVUyx1RwyszkLA4LY0RheUgmhCCQIA68AgBRIQjVkZs1pzCYV+25QQZBhp1KxqmyfW4yexvmwuD3y/A963021XLHSUTf6wQbtokJsLMrQ5dLrV9SR4c3QY9Wbn3gNuaLWr/lCJdzczyrNSMmJFoVUz4xjVPqU5Y5NXMjH6hrhkV4JmZ1qJT9s4IOfDTKZbpCfPJQYIqqkAViZet5XwKRJl6mo5K1RlVUCRIftwTFt6E8QQbvqdsjpVcgKfXxWK2l1BtXoVz+oRHtLZJObnA6HI7EaxJbdLwU+YS+neKWVtedSHVyEUobEm60BwHDe0OejYLP+i/vNm+uANEn/fQ1yiKfBMW2Z0Ll3DCZZilXmqysKpDKJPSPweV2CV93nftgIifcAGgCmUjBfvHPsQbKYUcdb5kGGzNz5KBaBhp82cVMR1YreQhoqbVPpFpLson/MRKTDMOrQIdfd7c/BvzddBSrOI3ZjrdNbGgQRC1MY0fgvbH6+n7eQR2AgOJxvg8aKwoWNHcgAaEVLPRaoruyv+7ecBML+VAtAdDHWw5m9qXcs1wCf2Cozt9C+OPVcW7pOk3I7PgQfNUBvRnD1WgOAjvHIdrZdzlqZHmEZ+Gt/6nDhDgyb9QtolfC/8jU6WWFxl/jppevjlWq6E4IlHOL+JgS5AxKeXlxwwBzGG3LwRIjdIUEm7Hdbsdu1G0H3fSpcnz+r0gritVKSTdm/fmrN3Eo7U9dGK6z6kWHgpDKYPpAkmJ055hUlA44J/W06v5YDTSmc5H0LJJ9sgpwIDc4EGbOOI6PUDbgXqBz+SNCz4eN4WohC9sz477/KAzHhbqiKy627Na39UTKtZ4ITBneKD4LdCYoag0+ERd3gbR1PtZ4KVzX4sPvqFeEVX/faSuc6SuVO92H46oTdsE+Riz7ZcauCFmPo0oK3ECMDM+K5KbSYJSEvUb6R9oOD0qgFGnXGzeYVdd/4PHlmQmgUbXgFEjrxvVUU2fGABlTjAdpQW/II6/tstyuKGLuoOvXAW+EAiNduK/NaMTzpJkcVisxR1H3Lw4FMflqhTvZ3dT4OhX7wNHopVTqGQJhrY/cbGFj5kD1js1yhTZ5VcABihxTvYx1EfB8JwW8xbDrxT8wgID2SJcgoqxwwUJV7eR6hMyBGd8D5g6b7aob/3NZ/8wCibY+xpHupZIgDsIRKJixs61Gu13vQ6fULkwAx0JgPIIwymodUbBppN+i4vxzV18g6jj5zFtfsMLM7lGvku3ELIDgvrkfBiqgFSs7MUld0YksiJhcXcgieRN7GfRCLq111++VDtYELvrZ0J72bsLuQuERUS2TpTz3OnEc/Uo3QGXARTPfZ75sqb/HlEi6SZoDF+vDC1VtArCnNbyHXhc/ywfG1JY2gdUklps
Correct.
Incorrect.
Incorrect. Please try again.
1