Chapter 1. Working With Data 8.3
Working with Data: HOW DO WE KNOW? Fig. 8.3
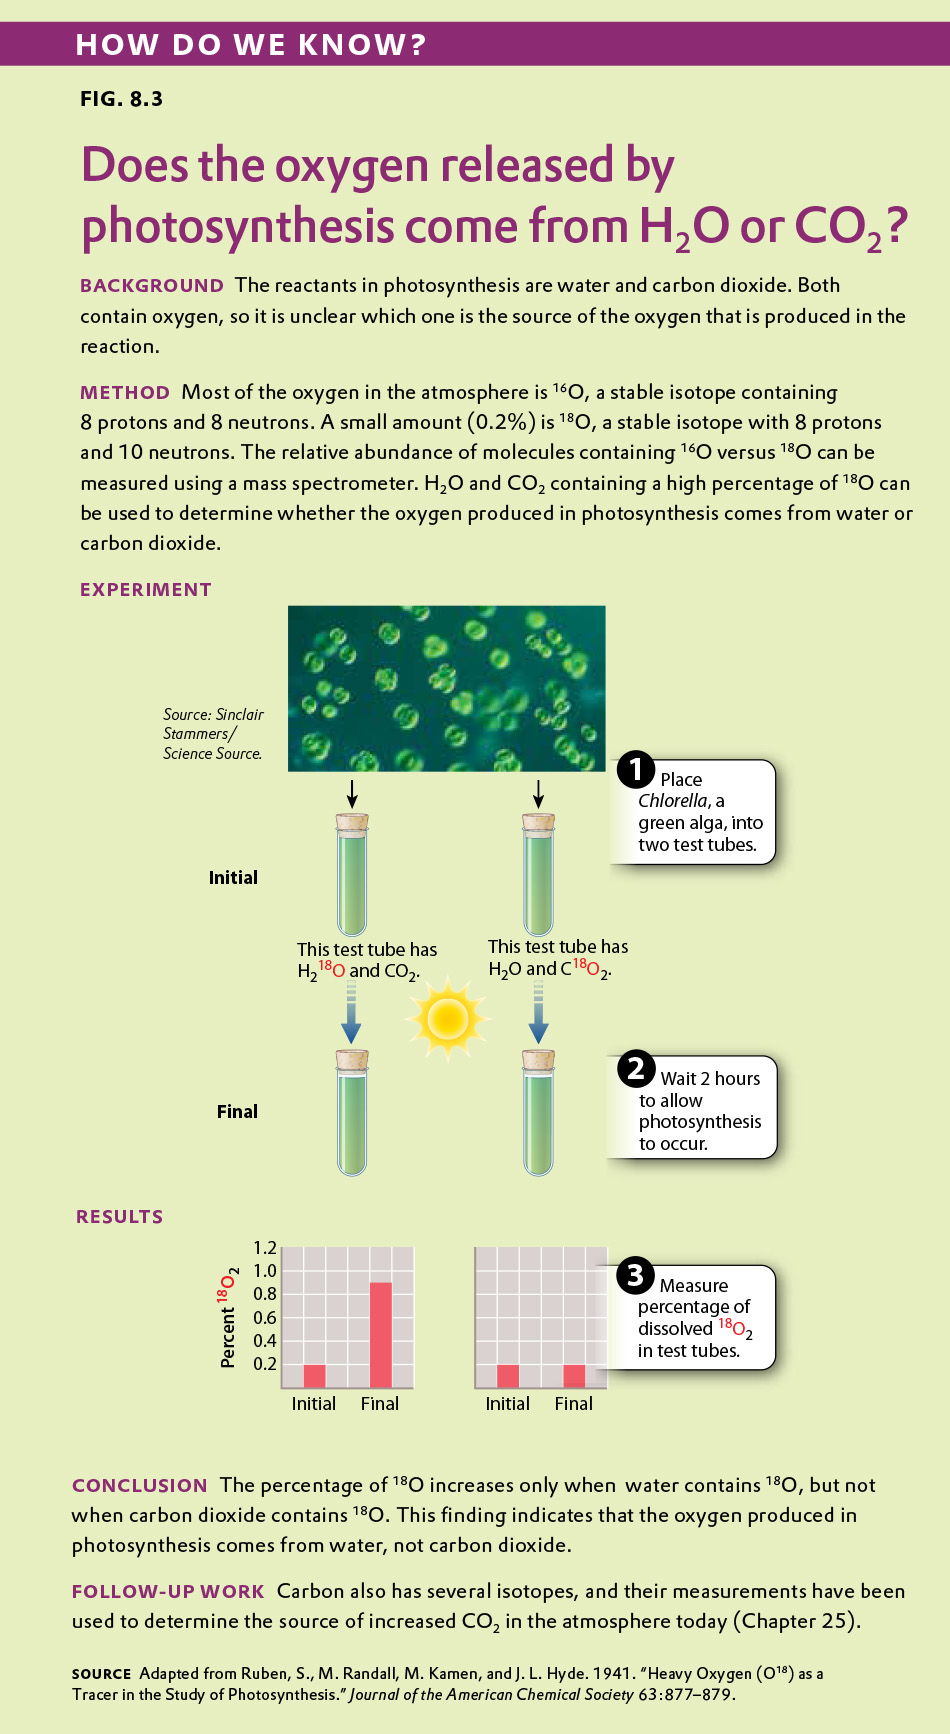
Fig. 8.3 describes experiments showing the origin of the oxygen released by photosynthesis. Answer the questions after the figure to practice interpreting data and understanding experimental design. Question #1 refers to concepts that are explained in one of four brief data analysis primers—the primer called “Experimental Design.” You can find these primers by clicking on “Experiments and Data Analysis” in your LaunchPad menu. Within the following questions, click on “Primer Section” to read the relevant section from these primers. Click on the button labeled “Key terms” to see pop-up definitions of boldfaced terms.

Question
The experiment in Fig. 8.3 allowed investigators to distinguish between which of the following hypotheses?
Hypothesis 1: Water (H2O) is the source of the oxygen released in photosynthesis
Hypothesis 2: CO2 is the source of the oxygen released in photosynthesis
Hypothesis 3: Both water and CO2 contribute oxygen atoms that are released as O2 in photosynthesis
Hypothesis 4: Oxygen released during photosynthesis is derived from something other than either water or CO2.
| A. |
| B. |
| C. |
| D. |
| hypothesis | A tentative explanation for one or more observations that makes predictions that can be tested by experiments or additional observations. |
Experimental Design
Experiments provide one way to make sense of the world. There are many different kinds of experiments, some of which begin with observations. Charles Darwin began with all kinds of observations—the relationship between living organisms and fossils, the distribution of organisms on the Earth, species found on islands and nowhere else—and inferred an evolutionary process to explain what he saw. Other experiments begin with data collection. For example, genome studies begin by collecting vast amounts of data—the sequence of nucleotides in all of the DNA of an organism—and then ask questions about the patterns that are found.
Such observations can lead to questions – Why are organisms adapted to their environment? Why are there so many endemic species (organisms found in one place and nowhere else) on islands? Why does the human genome contain vast stretches of DNA that do not code for protein?
Types of hypotheses
A hypothesis, as we saw in Chapter 1, is a tentative answer to the question, an expectation of what the results might be. This might at first seem counterintuitive. Science, after all, is supposed to be unbiased, so why should you expect any particular result at all? The answer is that it helps to organize the experimental setup and interpretation of the data.
Let’s consider a simple example. We design a new medicine and hypothesize that it can be used to treat headaches. This hypothesis is not just a hunch—it is based on previous observations or experiments. For example, we might observe that the chemical structure of the medicine is similar to other drugs that we already know are used to treat headaches. If we went into the experiment with no expectation at all, it would be unclear what to measure.
A hypothesis is considered tentative because we don’t know what the answer is. The answer has to wait until we conduct the experiment and look at the data. When an experiment predicts a specific effect, as in the case of the new medicine, it is typical to also state a null hypothesis, which predicts no effect. Hypotheses are never proven, but it is possible based on statistical analysis to reject a hypothesis. When a null hypothesis is rejected, the hypothesis gains support.
Sometimes, we formulate several alternative hypotheses to answer a single question. This may be the case when researchers consider different explanations of their data. Let’s say for example that we discover a protein that represses the expression of a gene. Our question might be: How does the protein repress the expression of the gene? In this case, we might come up with several models—the protein might block transcription, it might block translation, or it might interfere with the function of the protein product of the gene. Each of these models is an alternative hypothesis, one or more of which might be correct.