Chapter 2. Analyzing Enzymes and Enzyme Kinetics
General Purpose
This lab will introduce the concept of enzyme-catalyzed reactions and their role in biology. It will also serve to introduce you to a number of laboratory techniques as well as some important aspects in data collection and analysis.
Background
Chemical reactions are the basis of most biological processes. Many of these reactions require a catalyst to occur at rates that are necessary in biology. A catalyst increases the rate of a chemical reaction without being consumed or changed during the process. This change in the reaction rate is accomplished by reducing the activation energy (Ea) between reactants and products (Figure 1).
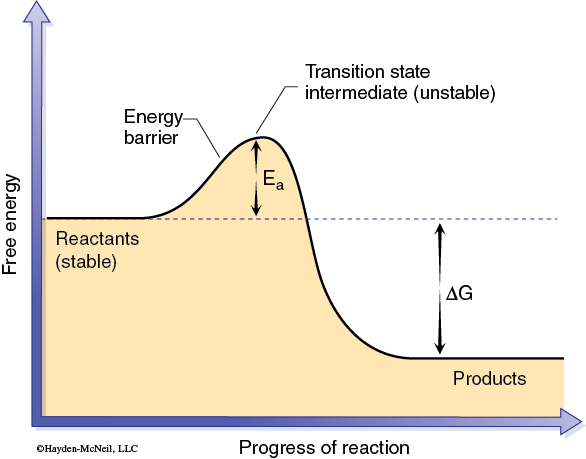
The activation energy can be thought of as the energy required to produce an activated complex needed for a reaction to occur. This activated complex may involve bringing two or more reactant molecules together in a proper alignment, or altering the shape of a particular reactant, or both. In effect a catalyst allows an activated complex to form with less energy (Figure 2).

The chemical reactions that are part of life are made possible by organic catalysts known as enzymes. Unlike other types of catalysts enzymes are highly specific. Typically a single enzyme molecule will catalyze only one chemical reaction. Biologically this means that almost every one of the innumerable reactions that occur in an organism is catalyzed by a different enzyme. Most enzymes are proteins and therefore have complex 3-dimensional shapes or conformations. The conformation of the enzyme is linked to how the enzyme functions. A general model of enzyme catalysis begins with the enzyme and substrate (reactant) molecules separate. The enzyme binds the substrate, and they form the enzyme-substrate complex (Figure 3).
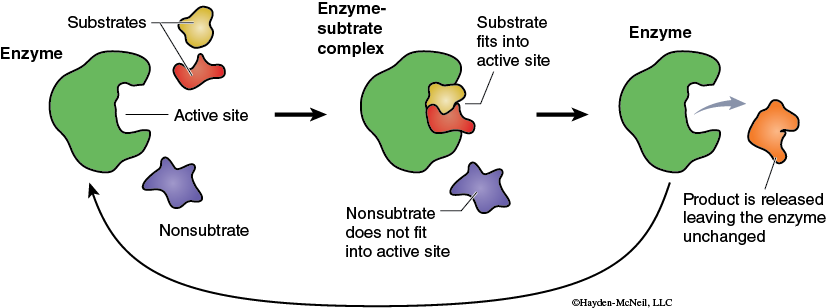
This activated enzyme-substrate complex is now in the proper alignment and the reaction proceeds. The result of the reaction is the conversion of the substrate into the product. The product, being chemically different from the substrate, no longer is attracted to the enzyme (Figure 3). The product and the enzyme separate, and the enzyme molecule is now available to combine with new substrate and go through this process again. A more detailed model of enzyme function is the Induced-Fit Model (Figure 4).
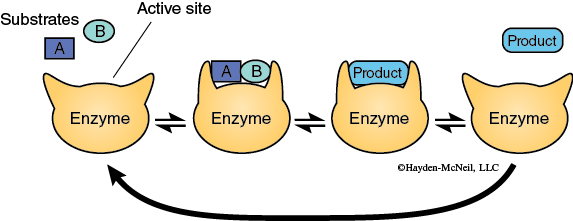
This model again begins with the enzyme and substrate molecules being separate from one another. The substrate is attracted to the active site on the enzyme and interacts chemically with the amino acids in the active site. This interaction causes the conformation of the enzyme to change which results in the formation of the activated complex, and the reaction proceeds. The substrate is converted into the product. The product interacts differently with the active site, causing a different enzyme conformation. This results in the product leaving the active site. The enzyme returns to its original conformation and can now bind new substrate and catalyze the reaction once again.
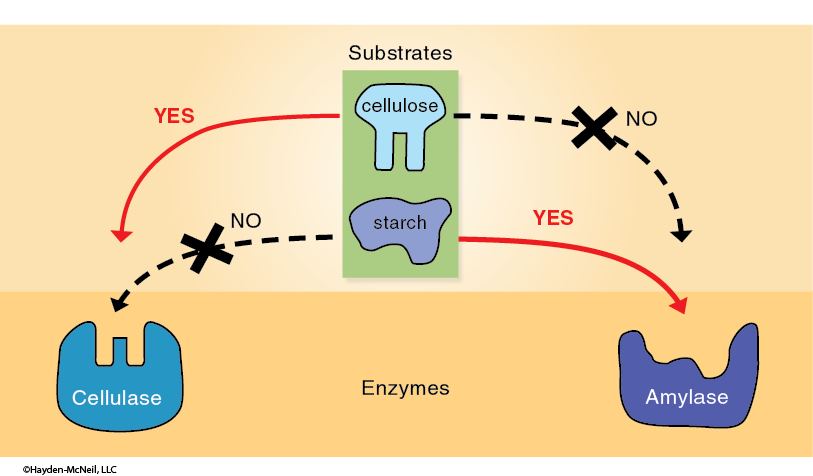
These models point out two important properties of this process. First, the enzyme and the substrate molecules come into physical contact and interact chemically. Second, the specificity of an enzyme is due to the conformation of the enzyme relative to the substrate molecule(s). Different enzymes have different conformations, especially at the active sites, which results in very specific catalysis (Figure 5).
Since the correct conformation of the enzyme and the active site are critical to catalytic activity, any factors which affect the shape of an enzyme also affect the rate of the reaction that the enzyme catalyzes.
Exercise 1. The Enzymatic Oxidation of Catechol–Reaction Rate
General Purpose
- Understand the general model of enzyme catalysis.
- Understand the relationship between light absorption and the concentration of a substance.
- Understand how to use a standard curve for the determination of an unknown.
Conceptual
- Gain proficiency in the use of pipets and pipetting.
- Gain proficiency in the use of a spectrophotometer.
Procedural
Background Information
The reaction we will follow in this exercise is the conversion of catechol to benzoquinone (Figure 6). Catechol is a naturally occurring compound found in many types of plants; it is especially common in fruits and storage organs.
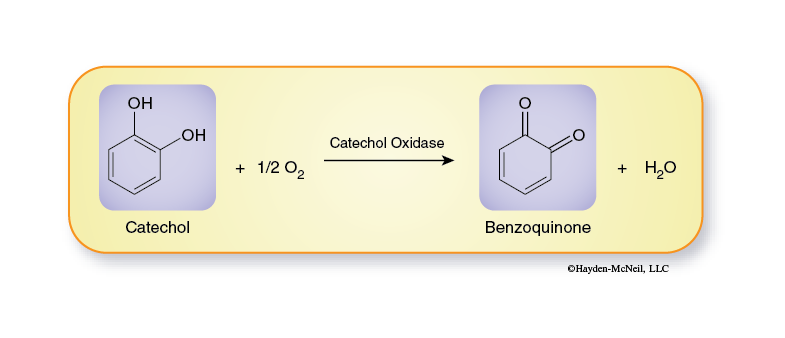
Enzymes typically are given the suffix -ase and are usually named for the reaction they catalyze. Since this reaction is an oxidation reaction, the enzyme is an oxidase and because catechol is the substance being oxidized, a more exact name for the enzyme is catechol oxidase (also commonly called catecholase).
To assay the rate of a chemical reaction it is essential to be able to observe the disappearance of reactant or the appearance of product. In the reaction we will monitor the conversion of catechol, which is colorless when in solution, to benzoquinone, a yellowish-brown substance. Because of this color change it is easy to follow the progress of this reaction using a spectrophotometer. Spectrophotometers are one of the most widely used laboratory instruments. Before continuing, read Appendix A, which describes the basic operation and use of a spectrophotometer in more detail. Benzoquinone (the product) is colored and follows Beer’s Law: Colored compounds absorb light at specific wavelengths. When monochromatic light at a specific wavelength passes through a solution containing an absorbing substance, the amount of light absorbed is directly proportional to the concentration of the absorbing substance. In other words, as the concentration of a substance in solution increases the amount of light absorbed by the solution increases.
In this exercise you will investigate how the rate of the reaction changes over time. This will provide a basic understanding of enzyme kinetics so that you may then design your own experimental protocol to investigate the effect of other manipulations on the rate of enzyme catalyzed reactions.
Exercise 1. Materials/Procedure
Materials Per Student
- Disposable gloves
- Safety Glasses
Materials Per Student Group (2 students)
- Spectrophotometer
- Test tube rack
- 2 small culture tubes
- Small Parafilm squares
- 1, 1 mL pipet and blue pi-pump
- Deionized water (dH2O)
- Potato extract
- 0.05M Catechol
- Sharpie
- 1, 10 mL pipet and green pi-pump
Procedure
- Turn the spectrophotometer on and allow it to warm up for 15 minutes.
- Obtain two small culture tubes. Use a Sharpie to label the top of the tubes “1” and “2.” Tube 1 will contain the “blank solution”; tube 2 will contain the “reaction solution.”
- To prepare the “blank solution,” use the 10 mL pipet to add 8 mL of deionized water (dH2O) to tube 1. Use the 1 mL pipet to add 1 mL of the potato enzyme extract to the water. Cover the mouth of the tube with a small piece of Parafilm® and invert the tube to mix well.
- Adjust the wavelength of the Spec 20 to 500 nm. Set the mode to transmittance. Properly zero and blank the spectrophotometer using the blank prepared in step 3 (Appendix A). Don’t forget to clean the surface of the tube with a Kimwipe® before placing it in the spectrophotometer.
- To tube 2, the “reaction tube,” add 3 mL of dH2O and 5 mL of 0.05M catechol.
- Add 1 mL of potato enzyme to the “reaction tube.” Quickly cover the mouth of the tube with Parafilm and gently shake the tube to mix the contents.
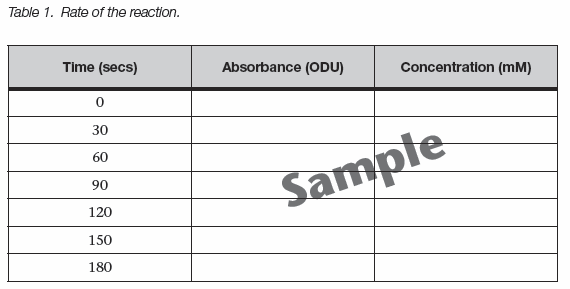
- Set the mode of the spectrophotometer to absorbance. Place the “reaction tube” in the spectrophotometer sample holder and record the absorbance in Table 1. This will be the absorbance reading for time “0.”
- Measure the absorbance every 30 seconds for 180 seconds. Make a data table on an NCR sheet using the sample below as a template.
- Remove the reaction tube from the spectrophotometer and note the color of the solution. How does the color compare to that of the solution at “0” seconds?
The observations you have made during this exercise measure how much light is absorbed by the solution. These observations must be converted to values that have more relevance (concentration of product) because reaction rates are often expressed as changes in the concentration of product over time. To make these conversions you will use a standard curve. A standard curve is a graph relating a measured quantity to concentration of the substance of interest in “known” samples. The standard curve plots assayed quantity (on the Y axis) vs. concentration (on the X axis). Such a curve can be used to determine concentrations of the substance in “unknown” samples. Using the standard curve for benzoquinone provided by your instructor determine the concentration of benzoquinone at each time interval.
Create a graph of product concentration versus time. Add a trendline and see how close your results come to a straight line. The slope of this line equals the reaction rate.
Exercise 2. The Oxidation of Catechol—Investigative Exercise
General Purpose
Conceptual
- Understand how various factors influence the rate of enzyme catalyzed reactions.
- Gain an understanding of how to formulate testable hypotheses.
- Design and conduct experiments to test your hypotheses.
- Gain experience presenting the results and conclusions of an experiment to other individuals.
The Scientific Method
Science, or more specifically the scientific method, is a method to logically answer questions. This process begins with observations. The observations lead to the formulation of models about a particular phenomenon. Based on the generalized model, specific hypotheses can be formulated. These hypotheses predict what will happen under specific conditions. As a result of these predictions the hypotheses can be tested experimentally producing new observations. These observations may be interpreted and then be used to improve the model. Science moves forward by producing more and more accurate models of natural phenomena.
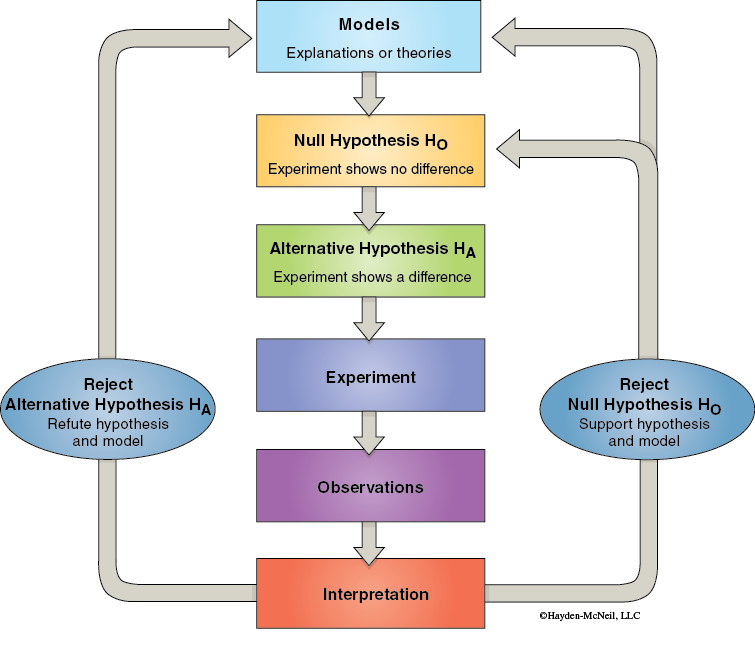
The formulation of specific and testable hypotheses is one of the most important and often the most difficult stage of the scientific method. An important consideration in the formulation of a series of testable hypotheses is to be sure that when tested the data will allow one of the hypotheses to be rejected, thereby allowing one to be supported. In order to ensure that this happens, researchers often state their hypotheses in the form of a Null Hypothesis (H0) and an Alternative Hypothesis (Ha). The null hypothesis states that the experiment will show no difference in the results between the control group and the experimental or treatment group. The alternative hypothesis is the alternative to the null and always states that there will be a difference in the results between the control and the experimental groups. Once the data are collected how are the researchers going to decide which of their hypotheses (null or alternative) should be eliminated? Science is a process of eliminating the hypotheses that are not consistent with the data and thereby supporting other hypotheses.
In this exercise your lab group will design an experiment to investigate the impact of one of the following treatments on an enzyme catalyzed reaction (i.e., oxidation of catechol).
Enzyme concentration
pH
Substrate concentration
Temperature
Structure of the substrate
Source of enzyme
As a group, decide which of the factors above you want to investigate and then make a prediction about how changing that factor might affect the rate of the reaction. Your prediction should be based on your understanding of how enzymes catalyze chemical reactions. If you have trouble with this, consult your textbook or ask your laboratory instructor for help.
Once you are satisfied with your prediction you can now state this as a set of formal hypotheses (null and alternative). Remember, the null hypothesis states that your treatment will have no effect on the process being studied. The alternative hypothesis is the alternative to the null and states that there will be some affect based on the treatment involved. The overall objective is to set up hypotheses which will result in one or the other being rejected (falsified) at the end of the experiment. Science only proceeds when a hypothesis is rejected. Remember in science you can only disprove something, never prove it.
Before leaving the laboratory, complete the following questions (1–7) and have it approved by your laboratory instructor.
1.
Null Hypothesis: What is your null hypothesis?
2.
Alternative Hypothesis: What is your alternative hypothesis?
3.
Briefly describe your proposed methods.
4.
How many replicates of this experiment are you going to conduct?
5.
In what form will you report your results (tables, figures, other)?
6.
What units will you use to report your results?
7.
What criteria will you use to determine which hypothesis is supported by your results?
Exercise 2. Procedure
Procedure
The outlines of the basic procedures for conducting experiments involving the various factors are listed on the following page. These are only outlines of the procedures. Before you begin your experiment you should write out the complete procedure that you are going to use. Review this with your laboratory instructor before you begin.
In Exercise 2, instead of measuring the reaction over time (i.e., reaction rate) as you did in Exercise 1, you will investigate the impact of one of these factors on the reaction. All the tubes will run for the same length of time (3 minutes), but they will differ in either what is added to them or the conditions under which they are run.
- Enzyme concentration
- Prepare a dilution series of the potato enzyme extract.
- Prepare a series of culture tubes containing 3 mL of water and 5 mL of 0.05M catechol (one for each enzyme concentration).
- Add 1 mL of potato enzyme extract dilution to start the reaction.
- Prepare appropriate blanks using the diluted enzyme solution.
- Measure absorbance at three minutes.
- Substrate concentration
- Prepare a dilution series of the catechol.
- Prepare a series of culture tubes containing 3 mL of water (one for each substrate concentration).
- Add 5 mL of catechol dilution.
- Add 1 mL of potato enzyme extract to each tube to start the reaction.
- Prepare appropriate blank.
- Measure absorbance at three minutes.
- Structure of the substrate
There are several isomers of catechol. These molecules differ only in the relative positions of the hydroxyl groups.
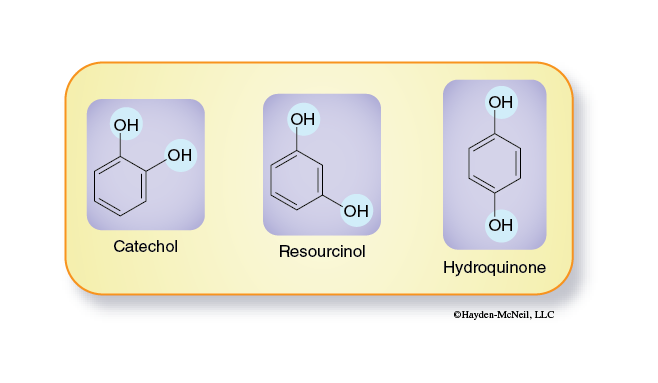
- Prepare a series of culture tubes containing 3 mL of water and 5 mL of one substrate solution (0.05M catechol, 0.05M resorcinol, or 0.05M hydroquinone).
- Prepare appropriate blank.
- Add 1 mL of potato enzyme extract to each tube.
- pH
- Choose a series of different pH buffers from the following list. Buffers of the following pHs will be available (3,5,7,9,11).
- Prepare a series of culture tubes containing 3 mL of each different buffer and 5 mL of 0.05M catechol.
- Prepare appropriate blank.
- Add 1 mL of potato enzyme extract to each tube.
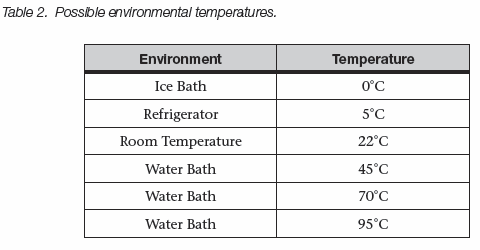
- Temperature
- Prepare a series of culture tubes containing 3 mL water and 5 mL of 0.05M catechol.
- Prepare appropriate blank.
- Place these tubes in environments with different temperatures (Table 2). Allow the tubes to equilibrate for 5 minutes.
- Add 1 mL of potato enzyme extract to each tube.
- Source of Enzyme
- Prepare the enzyme extract by placing 20 grams of the source material (minus the peel and any seeds, etc.) in a blender with 125 mL of cold deionized water.
- Blend until all the source material has been ground into fine particles.
- Filter the liquid into a flask making sure that all of the particulate matter has been removed from the liquid.
- This liquid is your new enzyme extract and should be used in place of the potato enzyme extract used in Exercise 1.
- Prepare appropriate blank.
Procedure Worksheet
Write out your complete procedure and discuss this with your laboratory instructor prior to beginning this experiment.
Step 1.
Step 2.
Step 3.
Step 4.
Step 5.
Step 6.
Step 7.
Step 8.
Step 9.
When you have completed your experiment you should analyze and plot your data. Although many people think of the words accuracy and precision as being synonymous they are not. Accuracy refers to the closeness of a measured or calculated value to its “true” value. A solution with a known concentration of benzoquinone will have a single, exact absorbance. If your absorbance reading was near this value, it was very accurate. An accurate reading can be the result of chance. You could have pipetted the wrong amount of the reaction solution, but then also read the spectrophotometer incorrectly, with these two errors canceling each other out and therefore producing a very accurate reading. Precision is the closeness of repeated measurements to one another. Precise measurements are not necessarily accurate, but generally a series of very precise measurements will also be very accurate. This is partially the reason experiments are usually repeated many times. It allows the investigator to obtain a precise estimate of the “true” value.
Repetitions do present one problem to the investigator. Once an experiment has been repeated several times, how can the results be analyzed? Usually this is done by performing some type of statistical analysis. The starting point for almost all statistical analyses is to describe the populations of data. One descriptor of a population of data is the mean. The mean is equal to the average value and as such describes the center of the population. Another descriptor is the standard deviation. This describes how far away from the center the points spread. Using both of these together the investigator can compare two or more populations of data. These statistic terms are explained further in Appendix B.
Conclusion
Each group will give a brief oral presentation to their laboratory section, explaining the results of their experiment and their conclusions about the interpretation of these results. Your group should be prepared to answer the following questions.
- Which of your hypotheses was rejected by your experiment?
- Does this agree with the predictions you made originally?
- Does this agree with your basic understanding of how enzymes function?
- What were the major strengths of your experiment?
- What were the major weaknesses of your experiment?
- What is the next experiment that you would conduct?