Chapter 2. Movement of Materials Across the Cell Membrane I
Exercise 1. Determining the Relative Osmotic Concentration of Plant Cells
General Purpose
This laboratory exercise is intended to give you some understanding of the process of osmosis as it occurs in plant cells. A general review and discussion of the data collected will occur during the laboratory period.
Learning Objectives
General Purpose
Conceptual
- Define and use the following terms: solvent, solute, diffusion, selectively permeable, osmosis, hypotonic, hypertonic, and isotonic.
- Gain an understanding of some of the factors that influence the movement of materials across cell membranes, including the principle of diffusion.
- Develop an appreciation of the osmotic responses and water balance of plant cells.
Procedural
- Determine the mass and the percent change in mass of living tissue.
- Increase your experience with graphical analysis and statistical interpretation of data.
In this exercise you will determine the molarity of the incubation solution where the mass of the tissue does not change, indicating that the solution is isotonic to the tissue. The relative osmotic concentration of tissue will be determined by a change in mass of the tissue. This is a relative measure of the osmotic concentration rather than the actual osmotic concentration because it does not factor in the turgor pressure within the tissue. Turgor pressure is a hydrostatic pressure exerted against the cell walls as a result of water uptake from osmosis.
Working in groups of two, make a prediction about how changing the concentration of the extracellular solution might affect the change in mass of the potato tuber cells. Your prediction should be based on your understanding of osmosis. If you have trouble with this, ask your laboratory instructor for help. Once you are satisfied with your prediction, you can now state this as a set of formal hypotheses (null and alternative). The null hypothesis states that your treatment will have no effect on the process being studied. The alternative hypothesis is the alternative to the null and states that there will be some effect based on the treatments involved. The overall objective is to set up hypotheses that will result in one or the other being rejected (falsified) at the end of the experiment. Science only proceeds when a hypothesis is rejected. Remember, in science you can only disprove something, never prove it.
Record the following in your laboratory notebook.
Prediction:
Null Hypothesis:
Alternative Hypothesis:
Materials
Balance and weigh boat
Marking pen
6 potato tuber segments
Razor blade
Forceps
Paper towels
Screen
Metric ruler
Cold tap water
6 – 250 mL beakers/disposable cups
100 mL deionized water (dH2O)
100 mL 0.1 M sucrose solution
100 mL 0.2 M sucrose solution
100 mL 0.3 M sucrose solution
100 mL 0.4 M sucrose solution
100 mL 0.5 M sucrose solution
Procedure
The mass of disks of potato tubers will be determined, and then they will be incubated in one of the sucrose solutions or water. After the disks have been incubated, you will determine the mass again. The mass values will be compared to determine any change in mass.
- Obtain six potato tuber segments, each approximately 4 cm in length, from your laboratory instructor.
- Use a sharp razor blade to remove any potato skin on the ends of the tuber segments. Then cut all of the segments to equal length (i.e., 4 cm).
- Place all six segments on a moistened paper towel and cover them with another moistened paper towel to prevent the tissue from drying out.
- Remove a segment from the toweling and place it on a dry paper towel. Use the towel to blot the sides and ends. Quickly slice the segment into thin disks (approximately 2 mm in thickness).
- Place the disks in an empty beaker/cup and quickly wash off the surface starch with cold tap water. Briefly swirl the slices in the water and then carefully pour off the water.
- Place the disks on a dry paper towel, spreading them so they are not touching. Quickly blot off the surface water.
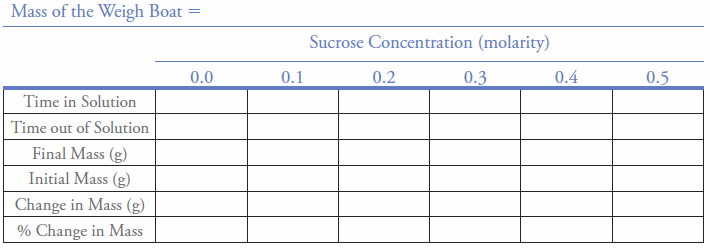
- Place an empty weigh boat on the balance and determine mass. Transfer the disks to the weigh boat and determine the mass to the nearest 0.1 g (minus the weight of the weigh boat). Create a data table on an NCR sheet like Table 5-2 in your laboratory notebook to record the data.
- Place the disks in the beaker/cup labeled dH2O and record the time the disks were placed in the water.
- Repeat steps 4 through 7 with each segment, placing the disks in the appropriate sucrose solution.
- Incubate all disks for one hour, swirling the beakers/cups every 10 minutes. To avoid confusion, assign the swirling task to one person.
Table 5-2. Estimating osmotic concentration of potato tuber cells by change in mass method.
- Remove the disks from the dH2O. Blot on a paper towel. Determine the mass of the disks and record the final mass and time out in the data table in your laboratory notebook.
- Repeat this procedure until all disks have been weighed. Determine the mass in the order in which they were initially placed in the sucrose solutions.
Clean-Up Procedure
- Dispose of potato pieces in the trash can in the laboratory.
- Rinse beakers/cups in tap water. Invert the beakers/cups on the table next to the sink so they drain.
- Rinse screens with tap water and place on the table with the plastic cups.
- MAKE SURE YOU HAVE DISPOSED OF USED RAZOR BLADES IN THE SHARPS CONTAINER ON YOUR LABORATORY BENCH.
- Clean up your work area and return all equipment to the appropriate locations.
Exercise 2. Determination of Diffusion Rate of Molecules of Varying Size and Polarity Across the Cell Membrane
General Purpose
This lab will present some of the concepts related to the movement of materials across cell membranes. You will also increase your experience in gathering and analyzing experimental data.
Learning Objectives
General Purpose
Conceptual
- Define and use the following terms: solvent, solute, diffusion, selectively permeable, osmosis, hypotonic, hypertonic, and isotonic.
- Gain an understanding of some of the factors that influence the movement of materials across cell membranes including the principles of diffusion and osmosis.
- Develop an appreciation of the osmotic responses and water balance of plant cells.
Procedural
- Determine the diffusion rate of molecules with varying size and partition coefficients (polarity) across a biological membrane.
Background Information
Molecules cross membranes by three major routes: (1) through the lipid bilayer, (2) through aqueous channels, and (3) by carrier-mediated transport. Several factors determine the rate of diffusion of a molecule across the membrane: size, polarity, and charge of the particular molecule. The rate of diffusion through the lipid bilayer for small molecules is determined largely by a combination of the size, shape, and polarity of the molecule.
In this exercise you will observe the effect of molecular size and polarity on the ability of certain molecules to pass through the red blood cell membrane. A given amount of blood will be mixed in a test tube with a solution of the test substance. The test tube is held in front of a slit lamp to measure the hemolysis time. The slit lamp consists of a diffuse light source positioned behind a piece of cardboard with a hole in which a black thread is suspended (Figure 5-4).
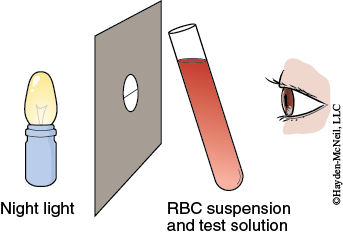
The tube containing the blood and test solution is held next to the thread so the light illuminates the tube. When you can first see the thread clearly, approximately 75% of the cells are hemolyzed.
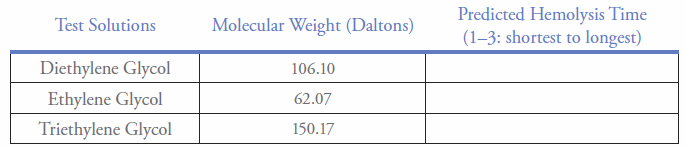
Using the information given above and the information in Figures 5-5 and 5-6 and Tables 5-3 and 5-4, predict the relative hemolysis times for each solution series and rank them from the shortest to the longest. Record your predictions and rankings in your laboratory notebook using Tables 5-3 and 5-4 as templates.
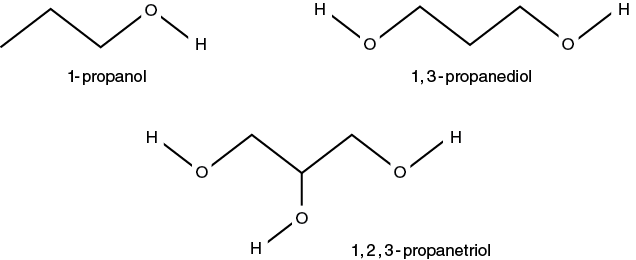
Table 5-3. Predicted hemolysis time for mammalian RBCs in 0.3 M solutions of propanols.
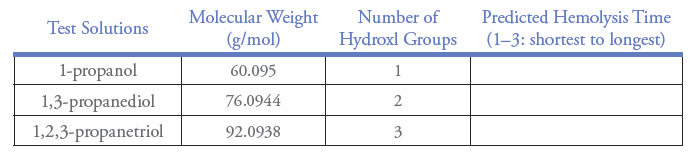
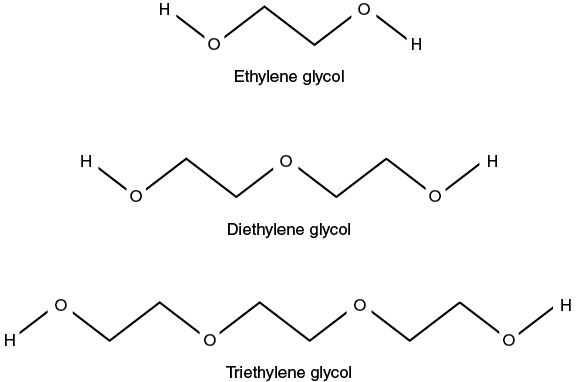
Table 5-4. Predicted hemolysis time for mammalian RBCs in 0.3 M solutions of glycols.
Materials
10 culture tubes/rack (9 reaction tubes, 1 tube for practice)
Erythrocyte stock suspension (2% whole bovine blood or ovine blood)
1 – 1 mL pipette
Small squares of Parafilm
Test solutions
1 pi-pump (blue)
Slit lamp
Procedure
- Work in groups of two or a number designated by your instructor for this exercise. Your instructor will designate either a propanol series or a glycol series for your group to use in this procedure.
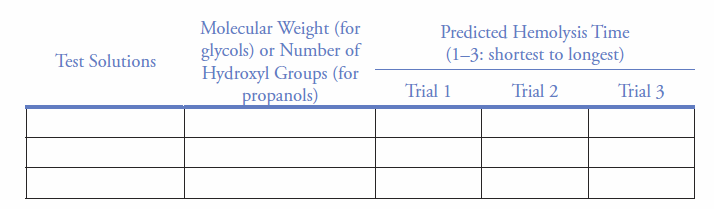
- In your laboratory notebook create a data table using the template shown in Table 5-5 below as a guide.
Table 5-5. Hemolysis time for mammalian RBCs in 0.3 M solutions of selected molecules.
- In the left column of your table, number the test solutions 1–3, top to bottom (e.g.,1-propanol is 1 if your group is using the propanol series).
- Label the culture tubes for replicates using your test solutions. Tube number 10 will be the practice tube. The diethylene glycol solution will be used for practice.
- Pipette 4 mL of the appropriate test solution into each numbered test tube and return to your work area to complete this exercise.
- Obtain 12 mL of the 2% bovine or ovine blood solution from your lab instructor. NOTE: If using the propanol series after practicing the technique with the specified practice solution begin by pipetting 1 mL of the blood suspension into each of the three tubes containing 1,2,3-propanetriol. This solution will take several minutes (10–20 min.) for hemolysis to occur. Be sure to record the starting time for these tubes. After 10 minutes read these tubes once a minute until the line is visible. After starting these tubes follow the steps as outlined for the remaining solutions (i.e., 1,3-propanediol and 1-propanol).
- CAUTION! BEFORE YOU BEGIN THIS STEP HAVE ALL SUPPLIES IN HAND. HEMOLYSIS MAY OCCUR RAPIDLY (i.e., less than 10 seconds).
Student 1: Thoroughly mix the 2% RBC suspension. Pipette 1 mL of the suspension into a test solution.
Student 2: Cap the test tube with a piece of Parafilm; seal it to the tube with your thumb and immediately invert the tube twice to mix its contents. Start the stopwatch; observe the tube’s contents through the slit lamp (Figure 5-4) until the thread is seen; immediately stop the watch.
Student 1: Record the hemolysis time for the test solutions in your data table in your laboratory notebook.
- Repeat step 7 until hemolysis time has been measured three separate times for all three solutions. Remember to mix the RBC suspension thoroughly each time before it is added to a test solution.
Clean-Up Procedure
- Remove all labels from culture tubes and rinse them with 10% bleach solution. Place the tubes in a designated container on your instructor’s cart. Make sure that the tubes are oriented in the same direction.
- PLACE USED PIPETTES IN THE BIOHAZARD BAG PROVIDED BY YOUR INSTRUCTOR.
- Clean your work area of the lab bench with a 10% bleach solution.
Post-Lab Quiz
Proceed to the Post-Lab Quiz