Chapter 2. Carbon Metabolism: Rate of Photosynthesis
General Purpose
This laboratory deals with the general concepts related to the measurement of the rate of photosynthesis. The first exercise will examine the effect of different light intensities on the net rate of photosynthesis, determined by measuring carbon dioxide consumption. In the second exercise leaf disk buoyance will be used as an indirect measurement of the net rate of photosynthesis.
Learning Objectives
General Purpose
Conceptual
- Understand the meaning of net photosynthesis.
- Understand the relationship between leaf disk buoyance or “time to float” and the rate of photosynthesis.
Procedural
- Understand the basic concept and setup of the Qubit CO2 analyzer.
- Understand the use of vacuum infiltration to sink the leak disks.
Exercise 1. The Effects of Different Light Intensities on the Net Rate of Photosynthesis as Measured by Carbon Dioxide Consumption
Before you begin your experiments write a null and alternative hypothesis about the effects of different light intensities on the rate of photosynthesis as measured by carbon dioxide consumption in your laboratory notebook.
Write what you predict will happen in this experiment.
Make a note of what the independent variable and the dependent variable are in this experiment.
For this experiment you will be working in groups of four.
Materials
Plant
Nylon-polyethylene gas bag filled with laboratory air
Laboratory stand to which other components are attached
Qubit infrared CO2 analyzer
Flow-through leaf chamber
Light source
Drying column
Air pump
Flow meter
PROCEDURE
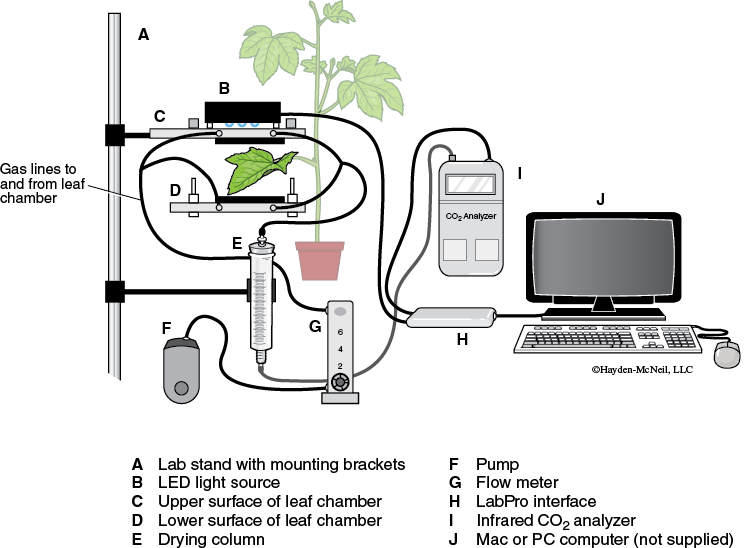
Please read the information on the use of the Qubit CO2 analyzer that is detailed in Appendix F. The setup of the instrumentation for this particular exercise should be similar to that shown in Figure 8-3.
Preparing the Gas Sample
The gas used throughout the experiment should remain constant with regard to the overall composition. Since animals (like students) use up oxygen from the atmosphere and produce CO2, the content of the atmosphere in the lab can change during the course of a lab period. To keep these changes from interfering with the experiment you will create a stable source of atmosphere to use during your experiment. This is achieved by filling the nylon-polyethylene gas bag with laboratory air using the air pump. Once the bag is full, seal it with the bite clamp until you are ready to begin the experiment.
Measuring the Reference Gas
- Remove the LED light source from on top of the leaf chamber and turn on the LED light source to a low reading (i.e., about 200) so that it can warm up. Note that the light source is shown in Figure 8-3 but is not shown in Figure 8-4.
- The infrared gas analyzer (IRGA) is on and has been set to the 2000 ppm range.
- On the computer, the “Photosynthesis CO2 Program” is open. There are two graphs displayed: one for CO2 and a second graph for the LED intensity. A table on the right-hand side of the screen indicates CO2 levels.
- Before you begin measuring photosynthesis, set a baseline for the CO2 content of the gas bag that has been filled with room air as a reference point. To do this, the leaf chamber should be empty and closed. The components of the system should be set up as follows:

- To measure the CO2 of the bag release the bite clamp on the gas bag tubing and TURN ON THE PUMP BY PLUGGING IT INTO THE BENCH ELECTRICAL RECEPTACLE.
- The flow meter has been set to read 0.5 L/min. If it is not functioning, alert your instructor.
- Select “COLLECT” in the “Photosynthesis CO2 Program” at the top of the computer screen.
- Once the values of CO2 appear to have stabilized (i.e., the graph is a straight line and the numbers do not fluctuate more than 1 ppm—about 2 to 3 minutes), record the level of CO2 concentration in the gas bag in your laboratory notebook. This is your “Reference CO2” concentration or “Baseline CO2 Value.”
Preparation of the Leaf Chamber
In your laboratory notebook make a note of the scientific name of the type of plant you are using for this experiment.
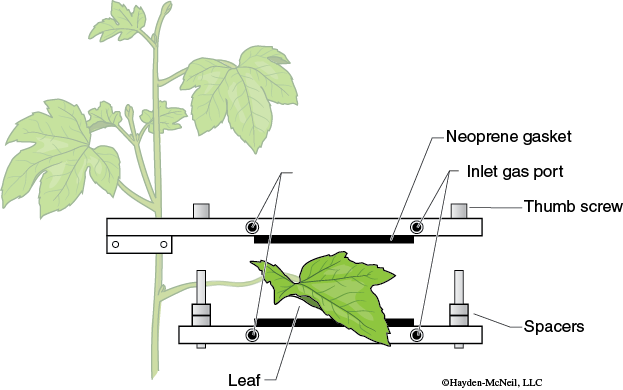
- Select a leaf near the top of the plant that is large enough to fill the entire leaf chamber. While keeping the leaf attached to the plant, seal the leaf into the leaf chamber. The leaf chamber consists of two pieces of Plexiglas bolted together and separated by gas-tight neoprene gaskets (Figure 8-4).
Spacers placed on the bolts prevent the neoprene from being over-compressed, and also ensure that the chamber has a fixed inner volume.
The upper piece of Plexiglas of the leaf chamber is attached to a bracket that may be positioned at any height on a laboratory stand. If you have to adjust the position of the chamber, try and keep the leaf attached to the plant.
- To place the leaf in the leaf chamber (DO NOT REMOVE THE LEAF FROM THE PLANT), unscrew the knobs until you can slide the leaf between the neoprene gaskets on the two halves of the chamber. You probably will want to adjust the height of the leaf chamber on the stand. Look at the chamber from below and make sure the leaf fills the entire chamber. Tighten the knobs.
Measuring CO2 Consumption by the Leaf
- With the leaf in the leaf chamber, the components of the system should be set up as follows:
- Place the LED light on top of the leaf chamber and adjust the LED to 200, the value for your first reading. Wait until the amount of CO2 consumption has leveled off. This may take several minutes, since the leaf has been maintained in a low-light environment prior to the experiment.
Table 8-3. CO2 consumption rates.

- Adjust the LED and take the reading of CO2 for the following LED values: 400, 600, 800, and 1000.
Interpreting the Results
Complete the calculations required to fill in the data in Table 8-3.
Use Excel to create a graph of the CO2 consumed per second per m2 as a function of relative light intensity.
Make sure to label each axis and write a figure caption.
CLEAN-UP PROCEDURE
- Remove the leaf from the leaf chamber and return the plant to the lighted area designated by your instructor.
- Make certain that the gas pump is unplugged.
- Detach the gas bag tubing from the gas pump and leave the bag at your work area.
- Equipment should cover the entire bench space: the computer at one end of the bench, the laboratory stand with the leaf chamber in the middle of the bench, and the gas pump and bag at the other end of the bench.
Exercise 2. Indirect Measurement of the Net Rate of Photosynthesis by Oxygen Production
Write what you predict will happen in this experiment.
Make a note of what the independent variable and the dependent variable are in this experiment.
For this experiment you will be working in groups of two.
Materials
2 syringes
Glass Petri dish
Hand-held paper punch
Sodium bicarbonate (NaHCO3) solution
Forceps
600 mL beaker filled with cold tap water
250 mL beaker
Reflector lamp and ring stand
Leaves
PROCEDURE
- Each group should obtain two clean syringes. The syringes will be used as a vacuum source for this exercise.
- Pour approximately 150 mL of 0.2% sodium bicarbonate (NaHCO3) into the 250 mL beaker. Use the markings on the beaker to measure. At your work area fill a Petri dish about two-thirds full with the NaHCO3 solution. Put the Petri dish aside.
- Remove the plunger from each syringe. Use a hand-held paper punch to cut 10–15 leaf disks from the available plant material into the syringe. Leaves can be stacked together and several disks can be cut at one time. Work quickly to avoid desiccation of the leaf disks.
- Carefully replace the plungers and draw up the NaHCO3 solution from the beaker by inserting the tip into the NaHCO3. Draw up the solution until the syringe is approximately half-full.
- Invert the syringe (i.e., tip up) and shake to separate all the leaf disks. The leaf disks should be floating at this time.
- Hold the syringe with the tip up and gently push the plunger up to remove all the air.
- Place your finger over the syringe tip and pull the plunger. This will create a partial vacuum, which will pull the air (oxygen) from the leaf disks. Shaking the syringe while pulling on the plunger may facilitate this process. You should see air bubbles coming from the edge of the leaf disks. Leave the leaf disks under vacuum for about 15–20 seconds. Remember the leaf disks will continue to float as long as they are under vacuum.
- Release your finger and the plunger.
- Shake the solution in the syringe and wait to see if any of the disks sink.
- Repeat steps 7–9 until the leaf disks sink. You might need to tap the side several times to help the disks sink. The goal is to have 10–15 disks per group; therefore, it is not necessary to sink all the disks.
- Pour the contents of both syringes into the Petri dish containing the bicarbonate solution. Discard any disks that are floating. You should have 10–15 non-floating disks in the Petri dish.
- Set the Petri dish with the bicarbonate solution and disks on the stand part of the ring stand. Place the large beaker of water (heat absorber) on top of the Petri dish. Make certain that the lamp is 30 cm from the Petri dish. Turn on the lamp.
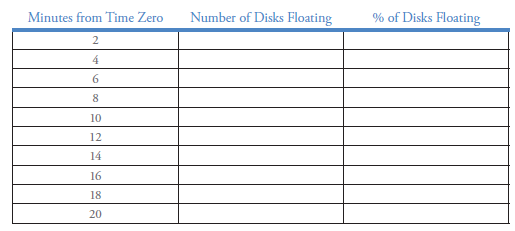
- Every 2 minutes record the number of disks that have floated or turned on edge in the table you prepared in your laboratory notebook that looks like Table 8-4.
Table 8-4. Data from floating disk investigation.
- Expose the leaf disks to light for 20 minutes or until all disks have floated or turned on edge.
- Turn off the lamp.
Interpreting the Results
Complete the calculations required to fill in the data in Table 8-4.
percentage of disks floating = (number of disks floating/total number of leaf disks) × 100
Record the class data in an Excel spreadsheet for the number of disks floating and the percentage of disks floating. Calculate the mean and the standard deviation of the percentage of disks floating. Create a graph of the mean of the percentage of disks floating as a function of time. Add error bars and best-fit line to the graph. Make sure to label each axis and write a figure caption.
CLEAN-UP PROCEDURE
- In order to minimize the number of leaf disks in the sink, rinse the syringes and Petri plate over the colander in the sink.
- Return the syringes to your instructor.
- Return the Petri dish to your lab bench.
- Empty the water and sodium bicarbonate in the beakers and return them to your lab bench.
- Return paper punch and forceps to the basket on your lab bench.
- Turn off reflector lamp.
- Make certain that all supplies listed at the beginning of this lab exercise are back in place for the next lab section.
Post-Lab Quiz
Proceed to the Post-Lab Quiz