Chapter 2. Carbon Metabolism: Fermentation
General Purpose
This lab focuses on measuring the rate of fermentation by yeast, Saccharomyces cerevisiae, in two different ways: 1) directly by measuring the CO2 production using the Qubit CO2 analyzer and 2) indirectly by measuring the amount of carbon dioxide produced in alcohol fermentation using fermentation tubes.
Learning Objectives
General Purpose
Conceptual
- Describe the process of alcoholic fermentation, naming the substrate and products.
- Explain how fermentation in yeasts can be measured.
- List factors that can affect the rate of yeast fermentation.
Procedural
- Measure the carbon dioxide production in fermenting yeast cultures of various sugar and sugar-substitute solutions.
- Analyze and interpret your data.
- Understand the setup and use of the Qubit CO2 analyzer.
Exercise 1. Direct Measurement of CO2 Production Using the Qubit CO2 Analyzer
Materials
Nylon-polyethylene gas bag filled with nitrogen
Qubit infrared CO2 analyzer
Reaction chamber (250 mL flask labeled “Reaction Flask”)
Laboratory stand to which other components are attached
Air pump
Flow meter
Drying column
Stock solution of yeast
Lactaid
0.5 M glucose stock solution
0.5 M lactose stock solution
0.5 M sucrose stock solution
1% starch solution
Deionized water
Water bath set at 40°C
PROCEDURE
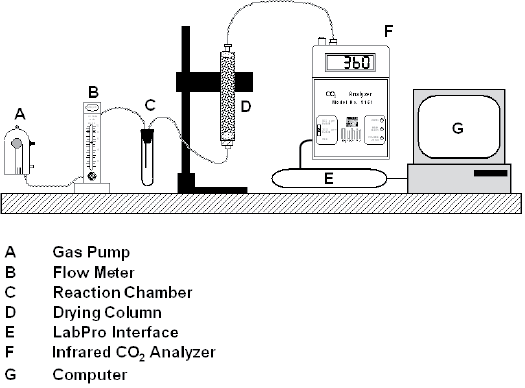
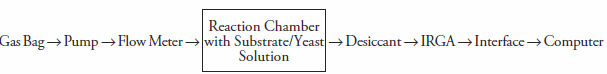
Please read the information on the use of the Qubit CO2 analyzer that is detailed in Appendix F. The setup of the instrumentation for this particular exercise should be similar to that shown in Figure 9-6.
Preparing the Gas Sample
The gas used throughout the experiment should remain constant with regard to composition. Since the atmosphere of the lab contains oxygen, and fermentation is an anaerobic process, we must provide the sample with an oxygen-free (or limited) atmosphere. This is achieved by filling the nylon-polyethylene gas bag with nitrogen (N2). Once the bag is full, seal it with the bite clamp on the bag tubing until you are ready to begin the experiment.
Measuring the Reference Gas
The level of CO2 in the gas bag will serve as a reference point to compare levels when CO2 production has occurred.
- The infrared gas analyzer (IRGA) is on and has been set to the 2000 ppm range.
- On the computer, the “Fermentation Program” is open. There is a graph displayed and a table on the right-hand side of the screen that indicates CO2 levels.
- Before you begin measuring fermentation, set a baseline for the CO2 content of the gas bag that has been filled with nitrogen as a reference point. To do this, the reaction chamber should be empty and closed. The components of the system should be set up as follows:

- To measure the CO2 level of the gas in the bag, release the bite clamp on the gas bag tubing and TURN ON THE PUMP BY PLUGGING IT INTO the bench top electrical outlet. The flow meter has been set to 0.5 L/min. If it is not functioning, alert your instructor. Record the reference CO2 level in your laboratory notebook.
Measuring CO2 Production
- Fill the reaction vessel with 20 mL of deionized water and 20 mL of the yeast solution.
- The components of the system should be set up as follows:
- Once the reaction chamber has been flushed, begin collecting data by “clicking” the collect data button on the computer. The CO2 level may change very rapidly and you may have to scroll the graph to see the readings.
- When the reading stabilizes (or after 10 minutes), record the value (you may want to refer to the tabular view for this).
- Open the reaction vessel and change substrates and yeast solutions. Repeat steps 5–8 with the remaining carbohydrate solutions.
- Record your results in the table you have prepared in your laboratory notebook that looks like Table 9-4.
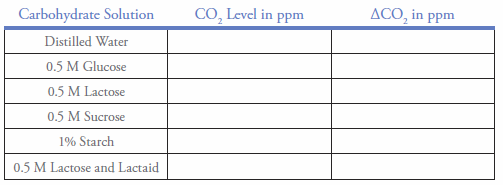
Table 9-4. CO2 production.
Interpreting the Results
Complete the calculations required to fill in the data in Table 9-4 by subtracting the reference CO2 level from the CO2 level for each solution.
Notice that all of the concentrations for the carbohydrate solutions are expressed as molarity except for the starch solution. This is because starch is a polymer of varying length. To get an idea of the molar concentration of a 1% starch solution, assume that all the starch molecules are 300 glucose units long. If this is the case, then what would the molecular mass of the starch be?
Since a 1% solution has 1 gram of solute per 100 mL of solution, a 1% starch solution has 10 grams of starch per liter of solution. Using the molecular mass you determined for starch molecules that are 300 glucose units long, what is the molar concentration of a 1% starch solution?
Use Excel to create a graph of the change in CO2 for the deionized water and the carbohydrate solutions.
Make sure to label each axis and write a figure caption.
Answer these questions in your laboratory notebook:
- Which hypothesis would be rejected on the basis of the results?
- What is the function of the distilled water + yeast solution?
- Explain how CO2 production could occur in the water + yeast solution.
- Which carbohydrate yielded the largest amount of carbon dioxide production by yeast?
- Why did the other solutions not produce as much carbon dioxide?
CLEAN-UP PROCEDURE
- Rinse the reaction flasks with deionized water and return to the bench with the Qubit equipment.
- Pour out any leftover yeast solutions and rinse the flask. Place the rinsed “yeast” flask by the sink.
- Empty the liquid waste container at your bench.
- Make certain that the gas pump is unplugged.
- Detach the gas bag tubing from the gas pump and leave the bag at your work area.
- Qubit equipment should “cover” the entire bench space: the computer at one end of the bench, the laboratory stand with the reaction flask in the middle of the bench, and the gas pump and bag at the other end of the bench. This makes it easy to check for missing parts.
Exercise 2. Indirect Measurement of CO2 Production Using Fermentation Tubes
Materials
Culture tube rack
6 culture tubes
6 fermentation tubes
6 Pasteur pipettes
1 pipette bulb
Marking pen
Stock solution of yeast
Lactaid
Deionized water
0.5 M glucose stock solution
0.5 M lactose stock solution
1% starch solution
0.5 M sucrose stock solution
PROCEDURE
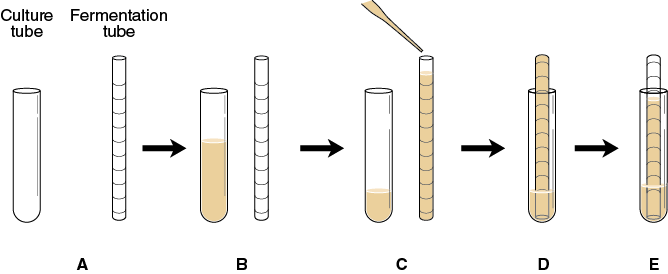
- Each carbohydrate solution to be tested for fermentation will need a culture tube and a fermentation tube for each sample (Figure 9-7A).
Label the culture tubes appropriately based on the solutions designated for your group (see Table 9-5).
Table 9-5. Test solutions.
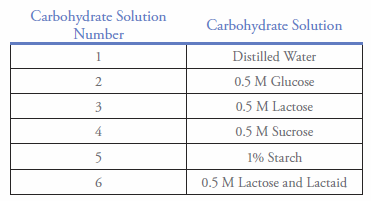
- Into each culture tube, add 5 mL of the yeast solution and 5 mL of one of the test solutions (see Table 9-5). Each culture tube should have a total volume of 10 mL (Figure 9-7B).
- Use a clean Pasteur pipette with a pipette bulb to fill each fermentation tube to the top with a different yeast–carbohydrate solution (Figure 9-7C). Standing the fermentation tubes in their respective culture tubes will help you keep them in order. Do not invert the fermentation tubes at this time.
- One by one invert each fermentation tube and place it upside down into the liquid remaining in its respective culture tube being careful not to introduce air bubbles (Figure 9-7D). If any air bubbles are in the fermentation tube, mark the air level in the tube.
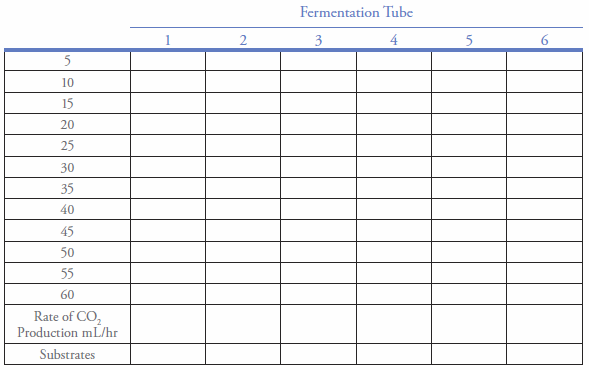
- Place the culture tube with fermentation tube in a water bath at 40°C. Incubate for 60 minutes. Observe and record any increase in the gas level in each fermentation tube every 5 minutes (Figure 9-7E) in the table you prepared in your laboratory notebook that looks like Table 9-6.
Table 9-6. CO2 production in yeast.
Interpreting the Results
Record the class data in an Excel spreadsheet for the volume of CO2 produced for each of the solutions. Calculate the mean and the standard deviation of the CO2 production for each substrate. Create a graph of the means of each of the solutions vs. time. Add error bars and best-fit line to the graph. Make sure to label each axis and write a figure caption.
In your laboratory notebook, answer the following questions:
- Compare the slope of the lines. Are there differences?
- Which hypothesis would be rejected on the basis of the results?
- Was the data for your group very different from the pooled group data?
If yes, how was it different?
- What could account for differences in the data between groups?
- What is the function of the fermentation tube containing distilled water?
- Explain how volume changes could occur in this tube.
- Which carbohydrate yielded the largest amount of carbon dioxide production by the yeast?
- Why did the other solutions not produce as much carbon dioxide?
CLEAN-UP PROCEDURE
- Rinse the fermentation tubes with distilled water several times and use a pipe cleaner as a test tube brush to clean the inside of each of the fermentation tubes. Invert the fermentation tubes in the container labeled “fermentation tubes.” Discard the pipe cleaner.
- Rinse the culture tubes and place them in the plastic box on your lab instructor’s cart.
- Make certain that all Pasteur pipettes have been discarded in the Broken Glass box.
- Make certain that all materials have been returned to their designated area.
Post-Lab Quiz
Proceed to the Post-Lab Quiz