Chapter 2. Laboratory Techniques: Lab
Exercise 1. Pipets and Pipetting
Procedure
- Pipetting Practice (work individually): Serological pipets
Fill 4 culture tubes with water using serological pipets.
When you have completed filling each tube compare the tubes from other students at your bench. Are the tubes for the same volume filled to the same level?
When you are finished empty the tubes and return them to the rack. Place the rack with tubes on the white paper to drain.
- Pipetting Practice (work individually): Micropipets
Using a practice card provided by your lab instructor, pipet 25 microliters (μL), 50 μL, 75 μL, and 100 μL of dye solution in the circles printed on the card.
Exercise 2. Spectrophotometry
Procedure
- Set the wavelength to 510 nm
- MODE = Transmittance
- Set Transmittance to 0% (sample holder is empty)
- Insert blank and set Transmittance to 100%
- Remove blank and insert sample
- Switch MODE to Absorbance
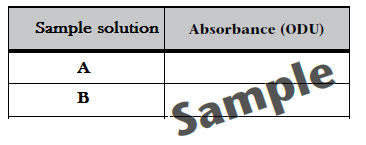
Read Absorbance for the two CoCl2 sample solutions A and B and record these in your lab notebook by creating a data table on an NCR sheet using the following template:
Concentration determination
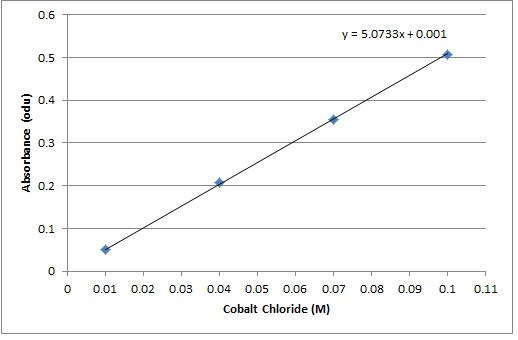
The observations you have made during this exercise measure how much light is absorbed by the solution. These observations must be converted to values that have more relevance (concentration of product) because reaction rates are often expressed as changes in the concentration of product over time. To make these conversions you will use a standard curve. A standard curve is a graph relating a measured quantity to concentration of the substance of interest in “known” samples. The standard curve plots assayed quantity (on the Y axis) vs. concentration (on the X axis). Such a curve can be used to determine concentrations of the substance in “unknown” samples. Using the standard curve for cobalt chloride shown below determine the concentration of CoCl2 for the two sample solutions.
Record the values for the concentration of cobalt chloride in each of the sample solutions in your lab notebook.