Chapter 17. Variation of Reaction Rate with Temperature
Discussion
Objectives

- Understand the relationship between the reaction rate, k, the activation energy, Ea, and the temperature at which a reaction occurs.
- Become familiar with the Arrhenius equation for activation energy and be able to mathematically manipulate the equation to meaningfully graph experimental data.
- Use experimental methods to determine the activation energy of a reaction.
Introduction
In the previous lab we studied a reaction using absorbance to determine the rate law and rate constant. In this lab we continue our study of kinetics by looking at the effect of temperature on the reaction rate. It is generally known that an increase in temperature increases the rate of a process of reaction. Your beach towel dries faster in the sun and milk keeps longer in the refrigerator. At higher temperatures molecules move more quickly, and will collide more frequently and with higher energy thereby increasing the rate of reaction.
Connection to Lecture
In lecture we have learned that the rate of a reaction depends on four factors:
- Nature of reactants and products
- Concentrations
- Temperature
- Outside agents and catalyst
In this experiment, you will investigate the effect of temperature on reaction rate; all other factors will be held constant.
In 1888 a Swedish chemist, Svante Arrhenius, proposed that molecules need a minimum amount of energy to react. Activation energy, Ea, is the minimum energy required for reaction to occur. The rate constant, k, the activation energy, Ea, and the temperature, T in Kelvins, are related by the Arrhenius equation.
where A is a constant characteristic of the reaction and R is the gas constant, 8.315 J • mol-1 • K‑1. Values of Ea will vary for different chemical reactions.
Question 17.1: Will a higher or lower Ea correspond to a larger or smaller k? Does this indicate a faster or slower reaction?
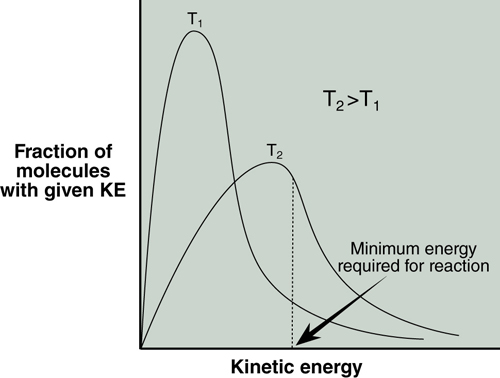
Consider the distribution of kinetic energies for the molecules in a sample at two different temperatures shown in Figure 17.1. The activation energy for the reaction of these molecules is also marked. Molecules that have this minimum energy or greater (the area under the curve above the minimum) have the energy required to react. Notice that at the higher temperature, T2, a larger fraction of molecules have the minimum energy, Ea.
Question 17.2: Will the reaction be faster or slower at higher temperatures?
The Reaction Between Bromate and Bromide Ions
The reaction you are studying is an oxidation–reduction reaction between bromate and bromide ions in acidic solution.
The solution also contains phenol, C6H5OH, and methyl red indicator, which colors the solution red initially. The bromide that is produced will react with phenol forming tribromophenol, C6H2Br3OH.
The phenol is present in a limited amount. After all of the phenol has reacted, additional bromine will react with and fade the indicator. Since all solutions contain the same amount of phenol (in fact, the same amount of all reactants) the time required for the indicator to fade is a measure of time required for a given amount of reaction.
Two test tubes are prepared: one containing BrO3−, Br−, and phenol, the other containing sulfuric acid. The two test tubes are brought to the same temperature in a water bath. The indicator is added and the contents of the two test tubes are quickly mixed. Mixing initiates the reaction. The time from mixing until the red color fades is recorded. The process is repeated at six more temperatures.
Data Analysis of the Reaction Rate
In this lab you will be recording the time it takes for the red color to fade once the reagents are mixed. This will be done at varying temperatures. Using the Arrhenius equation we may relate the temperature and time back to the activation energy. It is useful to take the natural logarithm of both sides of this equation and to rearrange as follows:
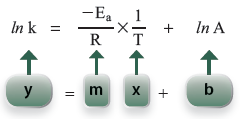
This equation has the form of an equation of a straight line. If the rate constant is determined at a number of different temperatures, a graph of ln k versus 1/T should be a straight line with a slope of –Ea/R and intercept of ln A.
In this lab we cannot directly measure the rate, but we can measure the time required for a given amount of reaction to occur, t. There is an inverse relationship between the rate constant, k, and time, t. A larger rate constant corresponds to a faster rate and a shorter time for a given amount of reaction.
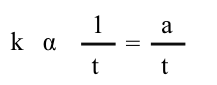
where a is the proportionality constant. Substituting into the above equation gives us:
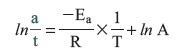
Then rearranging the equation will give us:
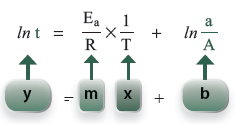
This is the equation we will use. This time required for a given amount of reaction to occur is measured at a number of different temperatures. A graph of ln t versus 1/T should be a straight line with slope = Ea/R.
Obtain the natural logarithm of the time at each temperature. Convert the temperature to Kelvin and take the reciprocal. Using graphing software, graph ln t on the y-axis and (1/T) on the x-axis. The activation energy is then calculated from the slope: Ea = (slope) × R.
Question 17.3: What will the units of activation energy, Ea, be?
Materials Required
Equipment
- 25- and 75-mL test tubes
- glass stirring rod
- 25-mL buret, clamp
- 10-mL pipet
- 10-mL graduated cylinder
- beakers
- water bath (600-mL beaker)
- Bunsen burner, wire gauze
- thin-walled rubber tubing
- ring stand, ring
- thermometer
Chemicals
- phenol, C6H5OH (aqueous solution, 0.40% by volume)
- solution of 0.10 M sodium bromide, NaBr
- mixed with 0.10 M sodium bromate, NaBrO3
- 0.20 M sulfuric acid, H2SO4
- methyl red indicator solution
- ice
Common Equipment
- none
Cautions
Be careful to avoid burns from the ring, beaker, and the open flame. Phenol is poisonous and caustic; wash your hands well. All solutions containing phenol and any waste should be kept and used in your hood because phenol is volatile—the fume hoods must be on. Goggles must be worn at all times.
Procedure
Answer questions in your lab notebook as you go along. Discussions with your peers and TA are encouraged.
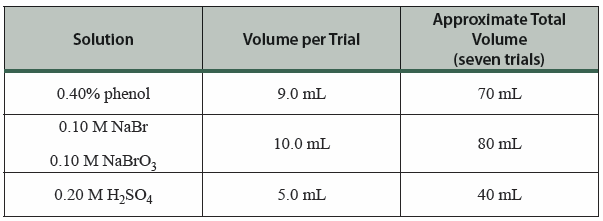
- Each trial requires the amounts of reagents listed in Table 17.1. Since the rate of reaction will be observed at seven different temperatures, obtain the approximate total volumes listed in Table 17.1 in three separate, small beakers.
Table 17.1 Volumes of reactant solutions.
- Set up a water bath using a 600-mL beaker, and start heating it to 75 °C. Place a white backdrop, such as a ceramic mat, behind the beaker, or a small piece of white paper inside the beaker.
- Use the buret to measure 9.0 mL of the phenol solution into the 75-mL test tube. Then use a 10-mL pipet to measure 10.0 mL of the NaBr/NaBrO3 into the same test tube and stir with a clean, dry glass stirring rod. Use a 10-mL graduated cylinder to measure 5.0 mL of the sulfuric acid into the 25-mL test tube. Put both test tubes into the water bath.
- When the temperature of the water bath reaches 75 °C, adjust the burner to maintain the temperature at 75 °C for at least two minutes before proceeding to step 5. It will be necessary to maintain the temperature throughout the timed reaction.
Question 17.4: Why is it important to heat the reactants separately to a constant temperature before beginning the reaction?
- Add four drops of methyl red indicator solution to the sulfuric acid. Pour the sulfuric acid into the other test tube, and mix the resulting solution with a clean, dry glass stirring rod. Record the time of mixing. Return the test tube to the water bath immediately, and leave it there throughout the timed reaction. Periodically stir the solution with the glass stirring rod.
- The red color due to the methyl red will fade and the tribromophenol will form as a white solid. Maintain the temperature of the water bath while watching for the complete disappearance of the red color; use the white backdrop mentioned in step 2. Record the time when the red color has disappeared.
Question 17.5: Should the time be recorded in minutes or seconds?
- Collect the reaction mixture in a beaker for disposal, clean and rinse the test tubes with distilled water, and shake out the excess water.
- Repeat steps 3 through 7 for the following temperatures (see step 4): 65, 55, 45, 35, 25, and 15° C. Ice can be used to lower the temperature. The reaction times will range from approximately 10 seconds to more than 10 minutes.
Waste Disposal
All solutions containing phenol and tribromophenol should be collected in a beaker at your desk. If your waste beaker contains white solid (tribromophenol), add 6 M NaOH and stir until it dissolves. Add the contents to the inorganic waste beaker in the hood and fill out the waste disposal sheet. Your lab instructor will dispose of the total volume in the appropriate container.
Points to Consider
In this lab you are measuring the time a reaction takes to proceed at varying temperatures. You are constructing a graph and determining the activation energy for the reaction.
- Include a table similar to the table on the report sheet. This must be made on a computer. On this same page report the slope from your graph and report the activation energy with proper units. Show all relevant sample calculations; these may be written if desired.
- Graph your data using a computer program; Excel works well. The y-axis is ln t and the x-axis is (1/T) with temperature in Kelvin. Add a line and report the equation for the line. The slope of this line is the activation energy.
- Discuss the times it took the reaction to proceed at each temperature measured. Relate this to k, the reaction rate, at the varying temperatures. What trend do you notice?
- How closely does the trendline fit for the graph ln t vs. 1/T? What is the R2 value and what does this indicate about the data?
- Mention the errors that may have affected your results and how these are noticed in the data.
- Determine the activation energy calculated for this reaction, with proper units. Does this number make sense? What ballpark range of Ea do you expect?