Chapter 20. Acid–Base Titration Curves: Determining pKₐ
Discussion
Objectives
- Follow a titration progression using a pH meter, recording the pH changes as more titrant is added.
- Use titration data to plot the titration curve to extract the pH at the equivalence point and the pH at ¼, ½, and ¾ of the equivalence point.
- Utilize the Henderson–Hasselbalch equation to determine the pKa of the acid analyte.
Introduction
We continue our discussion of acid–base chemistry by looking more carefully at a titration. In this lab you will be following the progression of a titration of a weak acid with a strong base by monitoring the pH and constructing a titration curve. We will use our data to study several regions of the curve and determine the pKa for this weak acid.
Connection to Lecture: Acid–Base Titration Curves
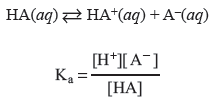
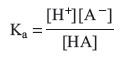
The acid ionization constant, Ka, for a weak acid (HA) is the equilibrium constant for the acid ionization in aqueous solution.
When titrating with a strong base, the concentration of each of these species is changing; this is a result of the neutralization occurring.
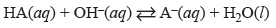
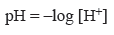
As base is added, the concentration of HA decreases, the concentration of A− increases, and the concentration of H+ will be controlled by the acid ionization equilibrium until the equivalence point is reached. We can experimentally determine the concentration of hydrogen ion, specifically the pH, during the course of a titration by using a pH meter. The pH is defined as:
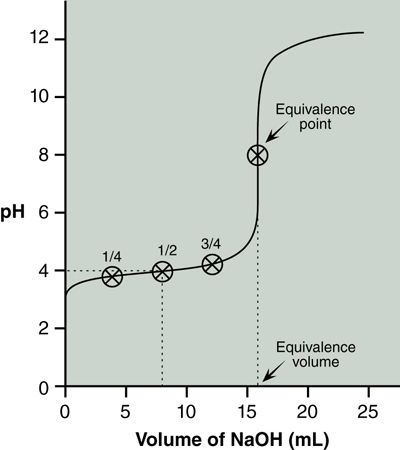
A titration curve is a graph of pH versus volume of titrant added. A typical curve for titration of a weak acid with a strong base is shown in Figure 20.1, below.
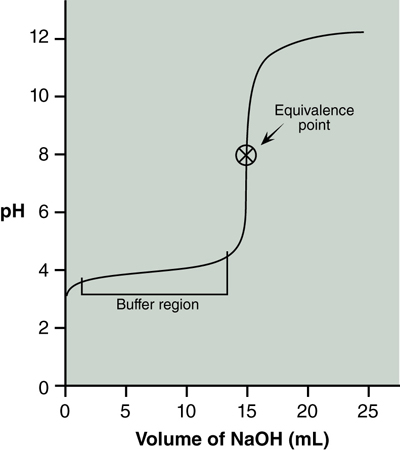
The pH of this acid is ~3 before any base is added. As base is added there is not a large change in pH initially. This is called the buffer region. As more base is added there is a sharp increase in the pH. The center of this portion indicates the equivalence point of the titration. Lastly, after the equivalence point the addition of more base continues to gradually raise the pH until it levels off. The two regions of this curve that we will study in this lab are the equivalence point and the buffer region.
The Equivalence Point
The equivalence point is at the center of the steeply rising portion of the titration curve shown in Figure 20.1. Specifically, it is the point where the slope of the curve changes from increasing to decreasing. In this lab you will use the data from your second titration to determine the equivalence point. If necessary, subtract the initial buret reading from each subsequent buret reading to obtain the volume of NaOH (in mL) added at each point.
Question 20.1: What data will you plot on the x- and y-axes to determine the equivalence point?
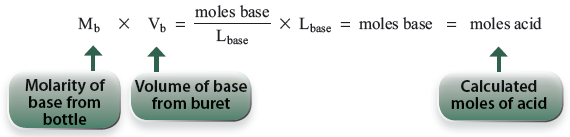
The graph needs to have fine grid lines in order to read the pH and volumes accurately. You will fit a smooth curve to the data points as in Figure 20.1 and mark the center of the steeply rising curve to obtain your equivalence point. At the equivalence point, a stoichiometric amount of base has been added to the acid.

We know the molarity of the base so we may calculate the moles of base and thereby get the moles of acid.
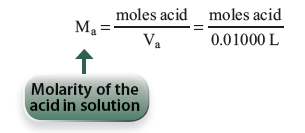
Then we may find the molarity of the acid by simply dividing the moles of acid by the volume of our acid added to the titration flask.
The Buffer Region
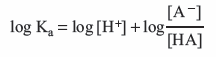
The other important region of the curve is the relatively horizontal portion between the first addition of base and the equivalence point; this is the buffer region. In this region the solution contains some unreacted weak acid, HA, and some A−, the conjugate base of the weak acid. The relationship between pH and relative amounts of HA and A− can be realized by a rearrangement of the Ka expression:
Taking the log of both sides we get
Then rearranging gives us
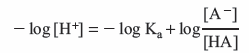
Lastly, applying the definition: pX = −log X gives us
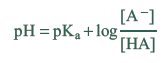
This relationship is known as the Henderson-Hasselbalch equation. If we measure the pH at a point where the ratio of [A−]/[HA] is known, pKa can be calculated. One point at which we know the ratio [A−]/[HA] is when ½ the volume required to reach the equivalence point has been added. At this point, half of the acid has been neutralized and converted to conjugate base, resulting in:
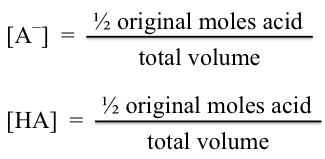
The concentrations of [HA] and [A−] are the same! Substituting these into the Henderson–Hasselbalch equation produces:
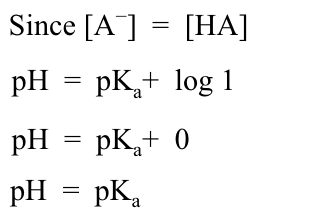
Reading the pH from the graph at ½ equivalence volume is the pKa. Figure 20.2 shows the equivalence point and volume, as well at the ¼, ½ and ¾ equivalence points. The pH at the ½ equivalence point is approximately 4.0.
Question 20.2: Notice in Figure 20.2 that the pH of the solution at the equivalence point is not 7. Why is that? Hint: Consider the base hydrolysis reaction of the conjugate base of the weak acid.
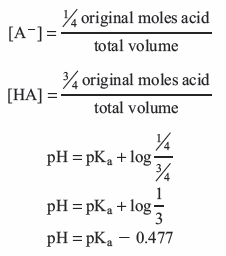
Another point we will use is when just ¼ the volume required to reach the equivalence point has been added. At this point, ¼ of the acid has been converted to conjugate base and ¾ of the acid remains. Substituting these into the Henderson–Hasselbalch equation produces:
Similarly, when acid is ¾ neutralized the equation is:
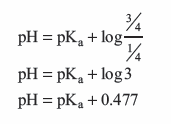
You will determine the pKa of your unknown acid using these three points. Read from your graph the pH at which ¼, ½, and ¾ of the equivalence volume has been added and use the Henderson–Hasselbalch equation to calculate pKa at each of these three points.
Materials Required
Equipment
- two 100-mL beakers
- 250-mL beaker
- 25-mL buret
- 10-mL pipet, pipet bulb
- 100-mL graduated cylinder
- ring stand, buret clamps
- stirring motor, stir bar
- pH meter
- pH electrode and wire
Chemicals
- standardized 0.10xx M sodium hydroxide, NaOH
- pH 4 buffer solution
- pH 7 buffer solution
- unknown acid solution
Common Equipment
- Kimwipes
Cautions
Sodium hydroxide solutions are caustic. If your skin or clothing comes in contact with NaOH solutions, hold the affected area under running water. Goggles must be worn at all times.
Procedure
All buret readings should be recorded to the nearest 0.01 mL. Discussions with your peers and TA are encouraged.
- Check out the pH meter, pH electrode, and magnetic stir bar from the storeroom window (ID required). Obtain a stirring motor from the cabinets in the balance room.
- Connect the electrode wire to the Twist-Lock input at the back of the pH meter. Push in the electrode’s Twist-Lock connector until it locks in place. Never lay the electrode on its side or invert the electrode. Twist the white plastic ring on the upper part of the electrode clockwise to the open position. Remove the black rubber cover from the end of the electrode and save it for step 17.
- Rinse a clean 100-mL beaker with about 10 mL of pH 4 buffer. Add approximately 40 mL of pH 4 buffer to the beaker. Label the beaker.
- Rinse a clean 100-mL beaker with about 10 mL of pH 7 buffer. Add approximately 40 mL of pH 7 buffer to the beaker. Label the beaker.
- Add approximately 100 mL of distilled water to a clean 250-mL beaker. Place the electrode in the beaker. Depress the on/off key on the control panel to turn on the instrument. Depress the setup key on the control panel. The display will read “Clear Buffers.” Depress the enter key to clear buffers and return to pH display. The pH should read between 6 and 8.
- Remove the electrode from the beaker. Shake off the excess liquid and blot the end dry with a Kimwipe.
- Place the electrode in the beaker containing the pH 4 buffer. Wait for the reading to stabilize—a block “S” will appear at the top left of the display. Press the standardize key. When the reading stabilizes, “4” will appear at the bottom of the display. The pH should read between 3.99 to 4.01.
- Rinse the electrode in the beaker of distilled water. Remove the electrode from the beaker. Shake off excess liquid and blot the end dry with a Kimwipe.
- Place the electrode in the beaker containing the pH 7 buffer. Wait for the reading to stabilize, then press the standardize key. When the reading stabilizes, the meter performs a diagnostic check on the electrode and displays “Good Electrode” or “Electrode Error.” If the electrode is good, a “7” will appear at the bottom of the display, next to “4.” The pH meter is now standardized. If “Electrode Error” is displayed, talk to your lab instructor.
- Rinse the electrode in the beaker of distilled water. Remove the electrode from the beaker. Shake off excess liquid and blot the end dry with a Kimwipe. Place the electrode back in the holder.
- Clean a buret with soap and water. Rinse well with distilled water. Drain out the water and rinse the buret with 5 mL of the standardized NaOH solution. Fill the buret to 0.00 mL with the NaOH solution. Record the molarity of the NaOH written on the label (4 significant figures). Use a white background for all titrations.
- Pipet 10.00 mL of your unknown sample into a clean, dry 100-mL beaker. Add approximately 40 mL of distilled water and a stir bar. Place the beaker on the stirring motor.
- Position the buret over the beaker. Place the electrode in the solution, being careful not to hit the stir bar. Use a clamp attached to a ring stand to hold the electrode. Turn the stirrer on at its lowest speed setting, being careful not to hit the electrode.
- Record the initial buret reading and the initial pH reading in your notebook. Titrate with the standardized NaOH solution, recording the buret reading and the pH after each addition of NaOH. Use 0.5-mL increments of NaOH initially, 1 to 2 drops from pH 5 to 9, and then 1-mL increments until a pH near 12 is recorded.
- Prepare a rough graph in your notebook of pH versus volume of NaOH added. Note the volume at the equivalence point.
- Repeat steps 12 through 14, adjusting the volume of NaOH added to give pH rises of approximately 0.2. Based on your graph from step 15, use 1 drop additions of NaOH starting at a pH of 5.5 so that at least four data points define the curve near the equivalence point. Then, adjust the volume of NaOH added to give pH rises of approximately 0.2 until a pH near 12 is recorded.
- Rinse off the electrode with distilled water. To disconnect the electrode wire, twist the connector ring in the direction of the arrow on the ring and pull. Twist the white plastic ring on the upper part of the electrode counter-clockwise to the closed position. Moisten the inside of the black rubber cover with a half-dropperful of pH 7 buffer. Replace the black rubber cover on the end of the electrode.
- Place the stirring motor back into the cabinet in the balance room. Press the on/off key on the pH meter before returning it, the electrode, and the magnetic stir bar to the storeroom window.
Waste Disposal
All solutions may be rinsed down the drain.
Points to Consider
In this lab you are following the progression of a titration of a weak acid with a strong base by monitoring the pH.
- Turn in the report sheet along with sample calculations. You should also turn in your graph of your titration. The graph must be made using a software program (e.g., Excel) but the equivalence point and the ¼, ½, and ¾ equivalence points along the curve may be written by hand. You may also use a computer-generated table for your data.
- Does the titration curve look as you had expected, based on what you have learned in the text and in lecture?
- What is the molarity of the acid, [HA], in your unknown?
- What is the pKa determined at the three special points on the titration curve? How well do these agree with each other?
- What sources of error would impact your results? How would these errors impact your experimental results?