Chapter 1. Emission of Light and Atomic Models
Discussion
Objectives

At the end of this activity you should be able to:
- Explain what photons are, and be able to calculate their energies given either their frequency or wavelength.
- Order the common kinds of radiation (UV, visible light, infrared) in the electromagnetic spectrum according to their wavelengths or energy.
- Calculate the wavelength of electromagnetic radiation given its frequency or its frequency given its wavelength.
- Be able to compare and contrast different models for the hydrogen atom.
- Distinguish between conceptual and physical models.
- Discuss how the emission spectrum of hydrogen gas was used to support (or refute) a given atomic model.
- Explain how electronic transitions between quantized energy levels are responsible for the emission of photons of light with different energies.
- Collect emission data and apply atomic models to explain the electronic structure of elements like hydrogen and helium.
These learning objectives are assessed in the post-lab Carmen quiz.
There is no laboratory report.
Introduction
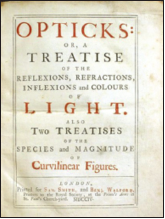
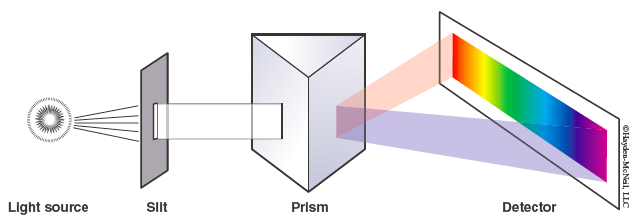
When light from the sun or white light is passed through a prism it produces a “rainbow” of different colors. This has been known for centuries, with Isaac Newton making significant advances in the area of “Opticks” in the 1700s by investigating how light is reflected, refracted, dispersed, etc.
However, something very different occurs when light from a single element is emitted and passed through a prism. In this case only a small number of discrete lines are observed. Even more remarkably, the pattern of these lines is a defining characteristic of each element. What happens when light is emitted from an element like hydrogen? As you will see in this investigation, the answering of this question has led to profound insights into the electronic structure of the atom and, in turn, our modern understanding of chemistry.
The emission of photons (particles of light) from atoms is thought to occur in the following way: First, the atom absorbs energy and an electron moves to a higher energy level, or “excited state." When the electron eventually returns to a lower energy state energy is released. The specific amount of energy released corresponds to the difference between the energy levels. When this energy difference corresponds to visible light then our eyes can observe the photons. It is also possible the emitted photons will have energies we cannot see, such as in the infrared or ultraviolet regions of the electromagnetic spectrum.
Atoms can absorb energy in various forms (heat, electrical, radiant) and subsequently emit photons. Today, in this investigation, you will complete activities that involve radiant energy (photons of light). In the experiment, you will return to this topic and investigate the role of heat and electrical excitations. In each case the emission of photons is similar, although different energy levels and different elements may be investigated.
| Activity | Comment | Estimated time | |
|---|---|---|---|
| 1. | Computer simulation: Models of the hydrogen atom. |
Worksheet | About 80 minutes |
| 2. | Emission spectra of hydrogen and helium recorded with a discharge lamp and spectroscope. |
Completed in lab | Data collection 10 minutes. Data analysis ~30 minutes |
| 3. | Post-Laboratory Carmen Quiz | Completed individually |
Completed outside of lab |
| Total lab time ~2 hours |
Total lab time~2 hours
All in-lab activities may be discussed with classmates and/or completed in a small group. The teaching assistant will help manage your time.
Laboratory Instrumentation
The instrument used to view line spectra is a spectroscope. Photons emitted from the atoms in their excited states strike the prism that separates them based on their particular wavelength. The resulting spectrum is superimposed on a scale and is viewed through the eyepiece. Note: Only the visible light portion of the spectrum is observed since the detector is the human eye.
Scientific Models
What is a scientific model? Sometimes scientists construct physical models that represent an object on a different scale. Models of an amoeba or bacterium (things very small made larger) or the solar system (something very large made smaller) are examples of physical models.


Scientists also devise conceptual models. A weather map is an example of a conceptual model. The weather map communicates some aspects of the weather, e.g., the temperature, areas of high and low pressure, precipitation, etc. It allows one to make predictions (will it rain in Columbus tomorrow?) and makes sense of a complex system. It is not, however, a physical representation.
Atomic models are conceptual. They aim to communicate different characteristics and make predictions for something that cannot be directly observed.
Part 1. Computer Simulation—Models of the Hydrogen Atom
One of the most tantalizing puzzles at the beginning of the 1900s was how to describe the atom. In Chapter 2 you learned about subatomic particles like protons, neutrons and electrons.
With this activity you will continue your own exploration. This begins by first observing a simulated light spectrum of hydrogen. You will then look at spectra predicted by different models of the atom. The models you will test include:
- John Dalton’s Billiard Ball model
- J.J. Thomson’s Plum Pudding model
- Ernest Rutherford’s Classical Solar System model
- Niels Bohr’s Shell model
- Louis de Broglie’s Electron Wave model
- Erwin Schrodinger’s Quantum Mechanical model
Procedure and Questions
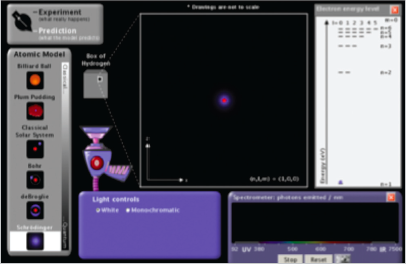
- Start the Models of the Hydrogen Atom simulation.
- Turn on the White light gun. The white light is shining into a transparent box containing hydrogen gas. This is the ?-box. The gas molecules have been separated so hydrogen atoms are present, but the scientists cannot see these individual atoms (hence the "?"). It is possible, however, to send light into the box and record the light that is emitted from the box.
- To record the photons of light emitted from the transparent box, check the Show Spectrometer box. Notice that the color of the photons being emitted from the box corresponds to a wavelength of UV, visible, or IR radiation.
- In the Light Controls, click on Monochromatic. Notice that the incoming photons are now all the same color. A spectrum slider appears that allows you to change the energy of the incoming photons. Move the slider across the spectrum from ultraviolet (UV) down to the infrared (IR). Notice how the color of the lamp and the photons moving up the screen change.
Common calculations involve converting between energy, frequency, and wavelength.
The following are useful expressions:
E = hν Planck's relationship for the energy of a photon where h = 6.63 × 10⁻³⁴ J s.
c = λν The speed of a wave is equal to the product of the wavelength × frequency,
1 nm = 1 × 10⁻⁹ m
The speed of light c = 3.00 × 10⁸ m/s in a vacuum.
| If a photon of monochromatic light has a wavelength of 94 nm, what is its frequency (expressed in units of s–1)? | |
| What is the energy of this photon (in joules)? | |
| What is the energy of 1 mol of these photons (in kJ/mol)? |
- Switch the Light Controls back to White light.
- Move the Slow…Fast slider all the way over to Slow.
- Watch the photons carefully. Most of the light gun photons pass through the box of hydrogen unaffected. Occasionally something happens in the ?-box and a photon is emitted. This emission is recorded by the spectrometer.
- Move the Slow…Fast slider all the way over to Fast, Reset the Spectrometer, and let the simulation run until the red column is near the top (it will take a couple of minutes). Then, use the Spectrometer camera to take a snapshot of the Experiment. This is the experimental emission spectrum for atomic hydrogen. (If you are working with a partner, have one computer collect the spectrum and work ahead on the second computer.)
- Describe or sketch (in the box below) the experimental emission spectrum for atomic hydrogen. Include in your description the colors (regions of the electromagnetic spectrum), estimated wavelengths, and relative numbers of stacked colored balls. These colored balls correspond to photons emitted by the ?-box.

The emission spectrum for hydrogen is a very important experimental observation used to support (or refute) different models of the hydrogen atom. Scientists cannot “look” inside the ?-box of hydrogen and actually see an atom. Instead, they construct theories and conceptual models to explain observations related to the atom. Models can be tested with experiments to learn if the model is useful for predicting how nature behaves
Your task in this simulation is to examine different models of the hydrogen atom. youwill 1) examine the model, 2) see how the model produces an emission spectrum forhydrogen, and 3) decide which model agrees best with the experimental data. It will be helpful to keep the experimental spectrum (the snapshot) available for comparisons.
Dalton’s Billiard Ball Model
10. In Chapter 2 you learned that John Dalton proposed that an atom was simply a very tiny hard ball. To see this simulated, in the top left corner, switch from Experiment to Predict and highlight the Billiard Ball model.
| Use words or a drawing to describe this model of the hydrogen atom. What is the atom like? | |
| What happens when photons interact with the atom in this model? |
a. The photons are absorbed by the atom. b. The photons are absorbed, and then other photons are emitted. c. The photons divide into smaller photons. d. The photons deflect off of the atom. |
| For this model is there an emission spectrum? |
Why do you think the Dalton model does not include electrons?
a. Dalton thought electrons were unimportant.
b. Dalton placed electrons in the nucleus.
c. The smallest particle in Dalton’s model is the atom, which is indivisible. It does not include sub-atomic particles like electrons.
d. Electrons were discovered by J.J. Thomson 50 years after Dalton’s death.
Thomson’s Plum Pudding Model
| Use words or a drawing to describe this model of the hydrogen atom. What is the atom like? | |
| What happens when photons interact with the atom in this model? |
a. The photon bounces off of the atom. b. A photon is absorbed and a different photon is emitted. c. The positive-charged proton "glue" interacts with the photon. d. All emitted photons have the same energy. |
Describe the resulting emission spectrum. Is it "right"? Does it agree with the experimental spectrum? |
Rutherford’s Classical Solar System Model
- Now click on and select next model, Rutherford's Classical Solar System model. This is the final atomic model you discussed in chapter 2.
| Describe this model of the hydrogen atom. What is the atom like? | a. There is a nucleus containing a proton. b. There is an electron circling the nucleus, like a planet around the sun. c. The electron looks like a wave. |
The Classical Solar System Model has a significant shortcoming. You may need to run the simulation at a slow speed, or pause it, to find it. What is the shortcoming of the solar system model?
a. Too many are photons emitted in the visible region of the emission spectrum.
b. Too many photons are emitted in the UV region.
c. The atom is not stable. The electron loses energy, spirals into the nucleus and the atom is destroyed. In this model atoms should not exist.
- Switch to the Bohr model, click on Show electron energy level in the upper right hand corner, and set the speed to Slow.
NOTE: The following questions are critical to you understanding the Bohr model. Take your time, discuss them with classmates, and ask questions!
Bohr's Model
| Describe this model of the hydrogen atom. What is the atom like? |
a. There is a nucleus where the proton resides. b. There is an electron in motion in a circular orbit. c. There are several possible orbits the electron may follow. d. All of the above. |
| What happens when photons interact with the atom? Does the electron move? |
|
Describe the resulting emission spectrum. Is it "right"? (You should let the simulation run for ~5 minutes on fast to compare with the experimental spectrum, then take a snapshot and save it.) |
In the Bohr model, electrons can exist only at certain energy levels (also called shells), not at any energy levels between them. Shells in this energy diagram go from 1 to 6. An increase in energy level (say from 1→6) can only occur if a photon of incoming light is absorbed. A decrease in energy level (say from 2→1) is accompanied by the emission of a photon as the excited electron releases its excess energy.
In the Help menu, select Transition, then fill in the missing entries:
| Transition Between n Levels | Wavelength (nm) | UV, Visible, or IR? (look at the spectrometer) |
|---|---|---|
| 1 ⇔ 2 | 122 | UV |
| 1 ⇔ 4 | 97 | UV |
| 2 ⇔ 3 | 655 | Visible |
| 2 ⇔ 6 | 410 | Visible |
| 3 ⇔ 4 | 1876 | IR |
| 3 ⇔ 6 | 1094 | |
| 4 ⇔ 6 | IR | |
| 5 ⇔ 6 | IR |
- Click on Show electron energy level diagram. Sketch the electron energy levels, paying attention to the spacing of the energy levels. Include the n-value for each energy level. The "n" is the principal quantum number.
- Set the Light Controls to Monochromatic.
- Set the monochromatic light source to 122 nm by clicking on the slider box and type in "122." This provides photons of just the right energy to raise (excite) the electron from n=1 to n=2 shell (1 → 2 transition).
What happens to the electron in the atom?
What happens to the energy level diagram?
What happens to the spectrometer? (You may need to reset the spectrometer.)
- Repeat this analysis with the light source set to 103 nm. This provides photons of just the right energy to raise (excite) the electron from n=1 to n=3 shell (1→3 transition). What do you observe?
- Just to make sure you understand this model, set the light source to 97 nm. This provides photons of just the right energy to raise (excite) the electron from n=1 to n=4 shell (1→4 transition). Can you make sense of the atom diagram, the energy level diagram, and the spectrometer?
- Set the light source to 656 nm. This corresponds to a transition from 2→3. What happens? Why?
Louis de Broglie was the first atomic theorist to incorporate the ideas of Planck and Einstein that electrons can exhibit properties of both waves and particles. The de Broglie hypothesis is that any moving particle or object has an associated wave character. He created a new field in physics called wave mechanics, uniting the physics of light and matter. For this he won the Nobel Prize in Physics in 1929. Among the applications of this work has been the development of electron microscopes.
- Set the Light Controls back to White. Switch to the de Broglie Electron Wave model. Investigate the model. Be able to discuss what is the same and different for the de Broglie and Bohr models of the hydrogen atom.
The de Broglie Model
Describe this model of the hydrogen atom. What is the atom like? How does it include waves? (Note: There is a pull-down menu to change from the |
(Circle all correct answers.)
|
What happens when photons interact with the atom? Compare the energy-level diagram with that of the Bohr model. |
|
Describe the resulting emission spectrum. Is it "right"? (You should let the simulation run for a few minutes to compare with the experimental spectrum, then take a snapshot and save it.) |
Erwin Schrödinger began working on wave mechanics in 1925. His interest was sparked by a footnote in a paper by Albert Einstein. Like de Broglie, he began to think about explaining the movement of an electron in an atom as a wave. In 1926 he published his work, providing a theoretical basis for the atomic model that Bohr had proposed. The equation at the heart of his publication became known as Schrödinger's wave equation.
The Schrödinger Model
| Describe this model of the hydrogen atom. What is the atom like? | (Circle all correct answers.)
|
|||
| What happens when photons interact with the atom? | ||||
| Are the energy levels different when compared with the Bohr model? | Sketch the energy levels.
|
|||
Describe the resulting emission spectrum. Is it "right"? (Let the simulation run for a few minutes to compare with the experimental spectrum, then take a snapshot.) |
What atomic model best agrees with the experimental emission spectrum for atomic hydrogen?
Part 2. Emission Spectra for Hydrogen and Helium
Materials Required
Equipment
- none
Common Equipment
- hydrogen and helium discharge tubes
- 5000 V step-up transformer
- spectroscope
Chemicals
- none
Cautions
The 5000 V step-up transformer and contacts for tubes on boards are an electrical hazard. Always wear your lab goggles, since they will block out almost all harmful UV radiation.
Procedure
Make sure the overhead lights in the balance room are off during observations.
A. Recording scale readings for hydrogen lines.
NOTE: The spectrum for hydrogen you are observing is what results when white light enters the ?-box in the computer simulation. To better understand your experiment, try to connect your observation with the Bohr model in the simulation.
- The power supply should be on and the discharge tubes should be uniformly bright. The slit should be open approximately the width of a piece of paper. A tube containing a bulb illuminates the scale, which should be visible along with the spectrum.
- Move the hydrogen discharge tube directly in front of the slit. While looking into the eyepiece, adjust the location of the discharge tube relative to the slit to give the brightest set of lines. Adjust the slit to sharpen the lines. It may be necessary to move the eyepiece slightly to focus the lines.
- The lines and the scale should both be in focus—consult your TA if the lines or scale are not both visible and horizontal. Center your view of each line by moving the eyepiece arm using the adjustment wheel, and record the scale reading, color, and intensity of each line in the table below. You will easily observe three lines, and you should also see a less intense violet line. (Does this agree with the computer simulation?) You will also observe a yellow line due to sodium in the glass wall of the tube. This is not part of the hydrogen emission spectrum, but it is worth noting.
Table 7.1 Hydrogen emission spectrum.
| Color of Line | Relative Intensity |
Scale Reading |
Wavelength (nm) |
Ninitial | Nfinal |
|---|---|---|---|---|---|
| Yellow (Sodium) | 589 | N/A | N/A | ||
Complete the table for the hydrogen emission spectrum. Use information from the computer simulation (Part 1) to determine the wavelength, Ninitial, and Nfinal. (See the table in step 12 of the simulation.)
B. Recording scale readings for helium lines.
- Move the helium discharge tube in front of the slit. While looking into the eyepiece, adjust the location of the discharge tube relative to the slit to give the brightest set of lines.
- Repeat step 3. You should observe 5–8 lines.
Table 7.2 Helium emission spectrum.
| Color of Line | Relative Intensity | Scale Reading |
Calculated Wavelength (nm) Based on Calibration |
|---|---|---|---|
Waste Disposal
None
Data Analysis
Calibration of Spectroscope
The scale readings for each spectrum are simply the location of photons after passing through the prism. Since you know the wavelength of each of these transitions for hydrogen you can use this information to calibrate the spectroscope and convert from scale reading to wavelength for the helium emission spectrum.
Construct a graph of the wavelength, λ (in nm) on the y-axis versus scale reading on the x-axis. Your calibration line should curve smoothly from the upper left to the lower right. Based on the calibration curve and the observed scale readings, calculate the wavelength for each line in the helium emission spectrum and enter them into the table.
Interpreting the Emission Data
The emission of light from hydrogen or helium is not a continuous spectrum. The light from the sun or a white light produces a “rainbow” spectrum, whereas the spectra emitted by a single element consists of a small number of discrete lines. In 1913 Neils Bohr provided an explanation for this phenomenon. In Bohr’s theory (which is investigated in the computer simulation) the atoms of an element emit radiation when electrons undergo a transition from a higher energy state to a lower one. The opposite occurs when light is absorbed; the energy moves the electron from a lower energy level to a higher one.
Hydrogen is the simplest element. An atom of hydrogen has only 1 proton (with a positive charge) and 1 electron (with a negative charge). The proton and electron experience an electrostatic attraction since oppositely charged particles attract each other. Finally, in Bohr’s model, the electron’s energy levels are quantized and stable; the electron does not lose energy and spiral into the nucleus.
In the Bohr model, the energy of an energy state is:
En = (–2.18 × 10⁻¹⁸ J) (Z2/n2)
where Z is the number of protons in the nucleus of the atoms of that element, and n is a positive integer identifying the energy state (or “orbit” of the electron).
The change in energy, ΔE, for an electronic transition is therefore:
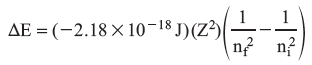
Common calculations involve converting between energy and frequency (Planck’s relationship E = hv, where h = 6.63 × 10⁻³⁴ J s) and between frequency and wavelength (c = λv, c = 3.00 × 10⁸ m/s).
In your notebook calculate the wavelength for each line in the visible region of the emission spectrum of hydrogen. In each case, nf = 2. Choose energy values higher in energy (ni > 2) and calculate the ΔE. Then, convert this to wavelength and express your answer in nm. Finally, check your answer by looking in Table 7.1.
Note: Questions similar to this one are frequently on General Chemistry exams!
Show your work for the calculation when ni = 3 and nf = 2.
Which statement(s) is/are true regarding the emission of a photon from a hydrogen atom? (Circle all correct answers.)
a. The emission of photons is an endothermic process, so ΔE is positive.
b. The emission of photons is an exothermic process, so ΔE is negative.
c. The wavelength of the ni = 3 to nf = 2 transition is shorter than the ni = 4 to nf = 2 transition.
d. The energy of the ni = 3 to nf = 2 transition is greater than the ni = 4 to nf = 2 transition.
After his initial success with the hydrogen atom, Bohr attempted to apply his theory to the helium atom, which has two electrons orbiting a nucleus consisting of 2 protons and 2 neutrons. Despite years (!) of effort and numerous modifications to his theory, Bohr was unable to extend his success beyond the hydrogen atom.
How do the emission spectra for hydrogen and helium differ from each other?
Using what you know about the Bohr model, the structure of hydrogen and helium atoms, etc., propose a model to explain why the spectra differ. There is not a single “right” answer for this question, but your response should be consistent with the available evidence. You may choose to communicate your model with words, drawings, equations, etc.
Activity Completed!
Activity results are being submitted...