Chapter 14. Scientific Measurements
Objectives
- Explore: Practice using laboratory balances and glassware to understand the uses and limitations of each and be able to choose appropriate lab equipment.
- Explain: Analyze the results and explain variation in measurements by using the concepts of precision and accuracy, significant figures, and determinate and indeterminate errors.
- Apply: Justify your choice of different laboratory resources, like glassware and balances, for use in future experiments.
Introduction
Two chemistry students are in a heated argument. Pete feels that “scientific experiments are done in a controlled manner and are reproducible if done correctly. Science cannot progress if measurements give different results every time.” But Claire responds that “scientists should take multiple measurements. Results are not always the same and it is wrong to simply perform one test and report the answer.”
Who do you think is right? If measured values are always the same, then why take more than one measurement? If measured values are different, does that mean that science is not reproducible? Or are “true” values never truly known?
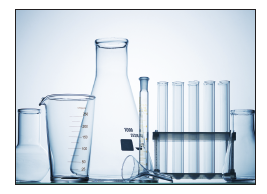
In this experiment, you will learn more about scientific measurements by investigating the density of water at room temperature and (perhaps) resolve this dilemma. In this process you will also gain familiarity and proficiency with several important laboratory resources including laboratory glassware and balances.
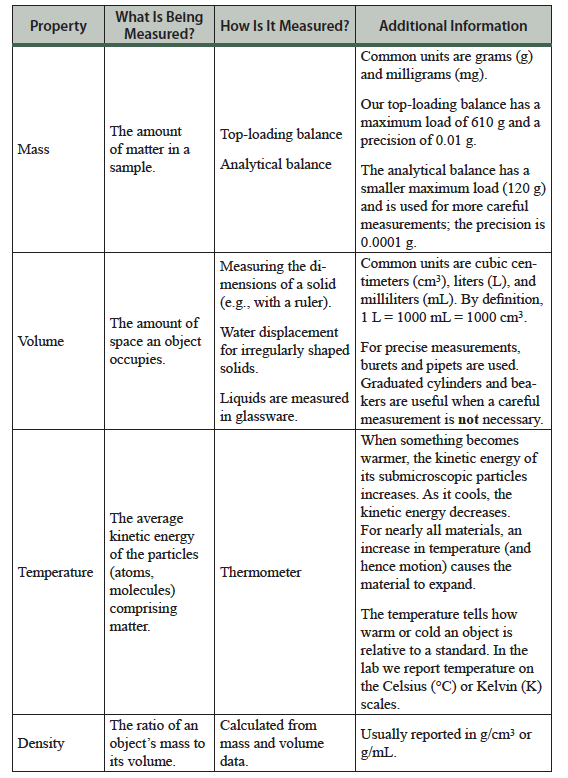
Table 1.1 Summary of properties measured in this experiment.
Reading Scale Values
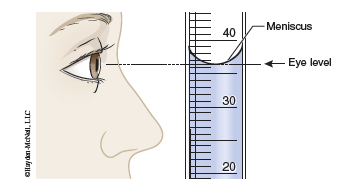
The volume of a liquid is measured in graduated glassware by recording the position of the bottom of the meniscus (the curved surface of a liquid in a tube). As shown in the figure, it is important to place your eye perpendicular to the glassware to obtain a correct reading. In this example a reading of 36.5 mL is appropriate. When reading a scale value the number you should record includes all of the digits that are known, plus one that is estimated. In this example, the bottom of the meniscus is clearly greater than 36.0 and less than 37.0; a reasonable estimate is 36.5 mL. Graduated laboratory glassware, like burets, graduated cylinders, and thermometers are read in this manner.
Calculations
Dimensional analysis is a common problem-solving approach and in this experiment it can be used for density calculations. Conversion factors are used to ensure that the answers to problems are in the correct units. In this method both the numbers and the units are multiplied together, divided into each other, or canceled out. The end result will be a number and a unit.
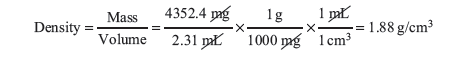
Example: A student weighed a marble to obtain a mass of 4352.4 mg and measured a volume, by displacement, of 2.31 mL. What is the density in g/cm3 of the marble?
The question is asking for density, which is mass divided by volume, in units of g/cm3. The measurements give us the mass and volume, but not in the units we need. We can use conversion factors with dimensional analysis to solve this problem:
Question 1.1: The student then decided to cool the same marble and see if the density changed. After analysis, the density of the colder marble was determined to be 1.91 g/cm3. What are the mass and volume of the cold marble?
Experimental Measurements
Precision and accuracy are commonly mentioned in discussions of experimental measurements. Precision refers to how closely individual measurements agree with one another and accuracy refers to how closely a measured value agrees with the accepted value.
Question 1.2: A chemist analyzed a liquid sample multiple times by two different methods. The sample has an accepted density of 0.9855 g/mL.
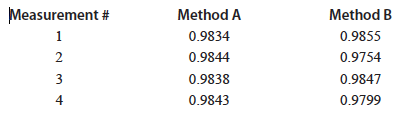
Which method has better precision?
Which method has better accuracy?
The chemist decided that Method A was better than Method B (do you agree?) and reported an average value of 0.983975 g/mL. This may seem like a good idea, but clearly their laboratory equipment can only determine the density to the 0.0001 place. It does not make sense to report an average value 0.983975 g/mL because it implies a much more precise measurement than the one possible with the available equipment. It would be possible to determine a density value to this level of precision, but it would require more sophisticated (and expensive) laboratory resources.
It is important to properly use laboratory resources to obtain and report the maximum number of significant figures, which are the digits that indicate the precision with which a measurement is made. For example, a mass reading on an analytical balance of 12.0409 g has six significant figures. Measuring the same object on a top-loading balance would result in only four significant figures. You should be able to explain this based on the precision of the instruments as listed in the table above. Your textbook has more information on the calculation of significant figures.
It should be recognized that the reported number of significant digits encompasses all measurements in a given procedure. Often, a single piece of glassware or instrumentation will limit the number of significant digits that can be obtained.
Returning to the above example, you will notice with Method A 1) the measured density value is consistently less than the accepted value, and 2) repeated measurements produced different density values. The idea of errors in measurement may be used to describe both of these.
Errors in measurement fall into two categories: determinate errors and indeterminate errors. A determinate error is one that has an identifiable source and can be corrected for. Examples of determinate errors include using a meter stick that is actually 1.020 meters long or reading the top of the meniscus instead of the bottom. Both of these errors can be identified and corrected. Note that determinate errors will have a directional bias. Using a “meter” stick that is 1.020 meters long will always result in an error that understates the actual length. It is likely that Method A has a determinate error that leads to a result consistently less than this value.
Indeterminate errors are ones that cannot be identified and corrected. For example, in our effort to obtain the maximum number of significant figures we estimate the last digit when reading a scale value. Sometimes the estimate might be too high, other times too low. In either event, it is not possible to estimate the last value in a reproducible way every time. This results in unavoidable variation in the reported value. Even when a value is recorded from a digital instrument (like with a pH meter or analytical balance) there is unavoidable uncertainty in the last digit. This means that, even if determinate errors are absent and the procedure followed flawlessly, there will be indeterminate errors that lead to variation in the measured values. Indeterminate errors will always lead to a range of measured values and they will not display the directional bias of a determinate error. If only indeterminate error is present, taking multiple measurements and averaging the results is a good way to approximate the true value. The fact that Method A did not always provide the same measured value is consistent with the unavoidable presence of indeterminate errors.
Finally, please note that a scientist’s treatment of error differs from how others view error. For a scientist, “error” is not forgetting to close the door or writing down the wrong number; if these mistakes occur, the experiment should be started over! Instead, errors are an inevitable part of measurement. To have the very best precision and accuracy it is important to identify and remove determinate errors and reduce the magnitude of indeterminate errors.
Experimental Design (Procedure)
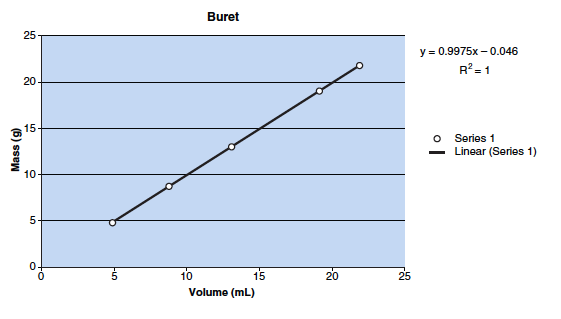
In this experiment, your task is to prepare plots of mass/volume for distilled water at room temperature using four different pieces of laboratory glassware. Each mass/volume plot should have at least four different measured values that are between 5 mL and 25 mL (see the following figure). The mass will be measured with a laboratory balance.
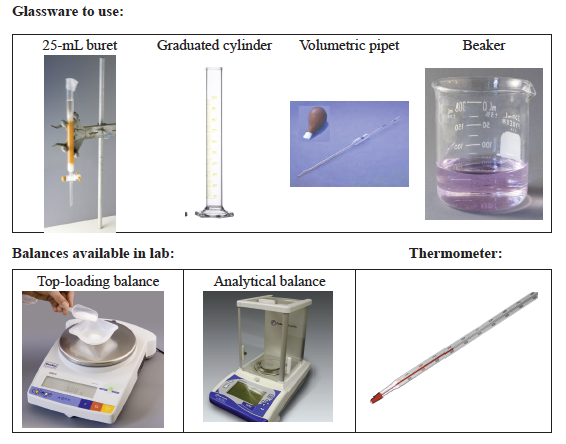
- At the start of the experiment the Teaching Assistant may demonstate the correct use of the 25 mL buret, the graduated cylinder, the pipet, and the beaker. They will also communicate the correct operation of the laboratory balance and thermometer.
- As mentioned above, a liquid’s density will be affected by temperature. Impurities in a liquid may also affect the density. For these reasons begin the experiment by adding distilled water to a 250 mL beaker and letting it reach room temperature. To avoid repeating this step add ~200 mL of distilled water. You will use this water in subsequent steps.
- Use a laboratory balance to determine and record the mass of a 100 mL beaker. This is the “weighing beaker.” Remember to tare the balance before the measurement. In your notebook record all digits; they are all significant.
- Fill the 25 mL buret with the water from step 2 and in your notebook record the initial reading to the correct number of significant figures. Remember, for a buret this is reading and estimating to the hundredths place, e.g., 1.03 mL or 0.07 mL.
- Transfer at least 5 mL of water to the weighing beaker. Record the buret’s final reading in your notebook to the correct number of significant figures. The final and initial readings will be used to calculate the volume transferred. Also record the temperature of the water. Liquid must NOT be transferred in the balance room.
- Return to the balance room and record the new mass of the weighing beaker with water in your notebook. Use the same balance for steps 3 and 5, remembering to tare the balance before each measurement. The mass of the empty beaker and beaker + water will be used to calculate the mass of water transferred.
- Repeat this procedure until you have four different values that are between 5 mL and 25 mL for the buret. Your results will be similar to those shown in the figure
- Move on to the next piece of glassware and repeat steps 3 through 6. After finishing with the buret, you should move on to the graduated cylinder, then the pipet, and finally the beaker.
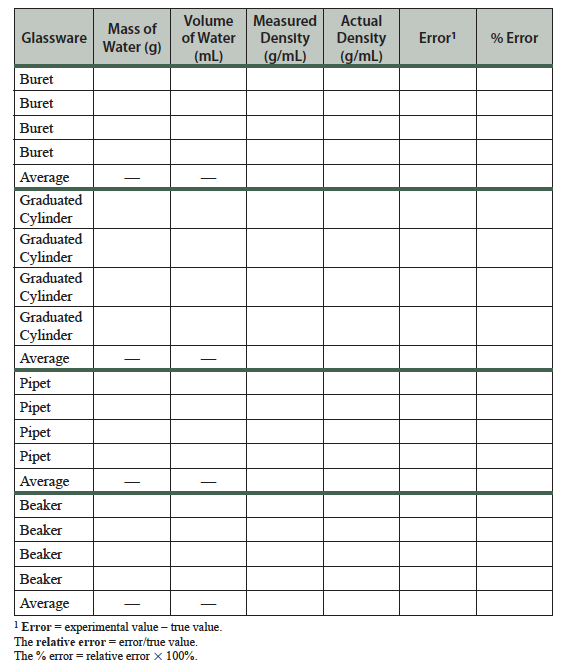
- After completing data collection, in your notebook reproduce the data table (shown on page 9) and begin filling it in. It is important to use the correct number of significant figures in the data table! Be sure to have your TA check your work at this point. You may need to collect additional data if your results are anomalous.
Materials Required
Equipment
- 2–100-mL beakers
- 1–250-mL beaker
- 1–400-mL beaker
- 1–600-mL beaker
- 2–125-mL Erlenmeyer flasks
- 3–250-mL Erlenmeyer flasks
- 1–25-mL buret and buret clamp
- 1–10-mL graduated cylinder
- 1–100-mL graduated cylinder
- 1–5-mL volumetric pipet
- 1–10-mL volumetric pipet
- rubber pipet bulb
- 1–thermometer (–20 °C–100 °C)
Chemicals
- none
Common Equipment
- top-loading balances
- analytical balances
- Parafilm (covers glassware)
Cautions
Goggles must be worn in the laboratory.
Procedure
You are responsible for recording your procedure in your notebook. You should provide a sufficient level of detail such that another scientist could repeat your experiment.
Waste Disposal
All solutions may be rinsed down the drain.
Data Table
(Use the correct number of significant figures)
Water temperature: ______________
Water, accepted density at room temperature (calculated): ____________
At 4 °C water’s density is 1.000 g/cm3. For the range of temperatures associated with “room temperature” (from about 20 °C to 30 °C), the density of pure water is:
Density (g/cm3) = [–0.00030 (g/°C · cm3) × Temperature (°C)] + 1.0042 (g/cm3)
Report Details
- Reproduce your completed data table. Be sure to use the correct number of significant figures.
- Prepare and submit four graphs of mass/volume. Each graph should have a title identifying the glassware employed, the axes should be properly labeled (including units), and a best-fit line fit (y = mx + b format) and the r2 value reported on the graph. Use a program like Excel for preparing the graphs.
Answer the following questions.
- In this investigation you used a buret, graduated cylinder, beaker, and pipet to transfer water. Which of these resulted in the most precise measurement? Which resulted in the least precise measurement? Use your experimental results as supporting evidence and explain your reasoning.
- Do your experimental results indicate the presence of determinate errors? Of indeterminate errors? In your answer demonstrate an understanding of these terms.
- A mass/volume plot includes two measured properties (mass and volume) and one calculated property (density). How does the plot illustrate the intensive or extensive nature of each of these properties?
- A student worked too quickly and, when using an analytical balance, recorded a mass reading of 25.3 g (ignoring the other digits). Similarly, when using a buret, he only recorded values of initial = 11.2 mL, final = 24.0 mL (failing to estimate additional digits). Later, recognizing these mistakes, he wrote down a mass reading of 25.3000 g and buret readings of 11.20 mL and 24.00 mL. Are either of these examples of determinate errors? Explain your reasoning.
- When using a pipet a student repeatedly makes several transfers with the top of the meniscus level with the mark instead of the bottom of the meniscus. As a result all of the volume transfers are 0.05 mL smaller than the actual volume.
Is this a determinate or indeterminate error?
Is the precision affected, the accuracy, or both?