Chapter 14. Emission of Light: Discharge Lamps and Flame Tests
Objectives

At the end of this activity you should be able to:
- Describe how discharge lamps emit photons following electrical excitation of gaseous atoms.
- Discuss the interdependence of scientific and technological developments. Specifically, how the technology of discharge lamps is connected to Bohr’s model of the atom and line spectra.
- Describe how thermal energy may lead to the emission of photons, and how this is accomplished in flame tests.
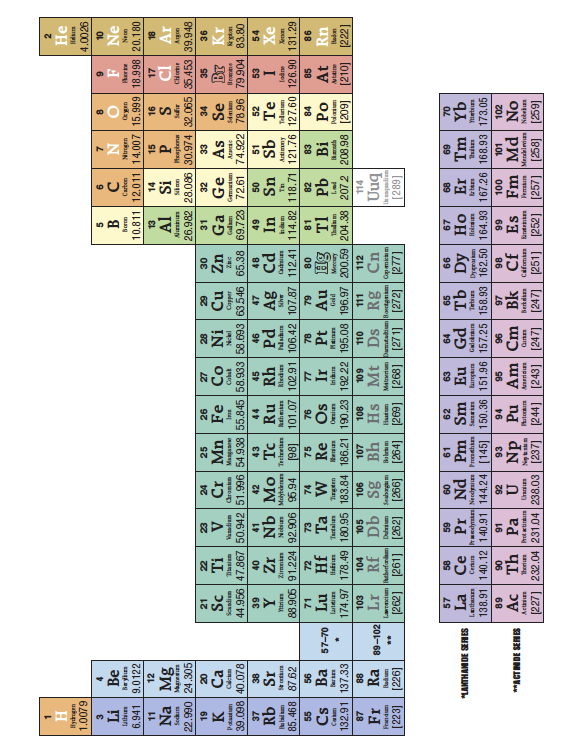
- Write the electron configuration for many-electron atoms in their ground state.
- Write the electron configuration of ions.
- Understand the meaning of ionization energy and how it is related to electronic energy levels.
Introduction
As you learned in an earlier investigation, when light is emitted from a single element (like gaseous hydrogen) and passed through a prism only a small number of discrete lines are observed. Atomic models account for this phenomenon by proposing that an electron absorbs energy and moves to an excited state. When the electron subsequently moves to a lower energy level a photon is emitted. The reason that discrete lines are observed, and not a continuous spectrum, is because the different energy levels in the atom are quantized. Finally, the energy moving the electron to an excited state may be radiant, heat, or electrical. In your earlier investigation of atomic models radiant energy led to the excitation. In this investigation you will consider examples of thermal (heat) and electrical excitations.
What are everyday examples of light being emitted following electrical or thermal excitation? Technological applications like sodium, neon, or mercury vapor lamps are based on electrical excitations and the brilliant colors of fireworks (kaboom!) depend on thermal excitations. Phenomena such as these are explained by extending our conceptual models from last lab (for hydrogen) to describe polyatomic atoms and ions.

Part 1. Flame Tests of Metals
When energy is added to atoms or ions of a particular element, electrons can absorb the energy and move to a higher energy level. When the electrons of these “excited” atoms or ions return to their normal ground state, energy is emitted.
As you have observed experimentally the emission spectra for hydrogen and helium are different from each other. Also, the energy level diagrams may be different for different elements and this means their emission spectra may be different. When you look at these excited atoms or ions with the naked eye you see only a single color that is the “sum” of all the individual colors emitted. In this activity you will observe this phenomena for different metal salts that have been excited by heating in a flame.
Materials Required
Equipment
- burner
Chemicals
- salts of various metals, such as sodium, potassium, calcium, barium, strontium, lithium, and copper
Common Equipment
- wooden splints (pre-soaked)
Cautions
Goggles must be worn throughout the experiment. Do not touch solutions with your bare hands. Use caution with the burner.
Waste Disposal
Metal salts go into the inorganic waste.
Procedure
- Light and adjust your Bunsen burner; ask for assistance if you are unsure how to use the burner.
- A test solution may be provided for each metal. If not, simply add a small amount of the provided solid salt (about ½ of a gram) to a small amount of distilled water (about 10–20 mL) to prepare a reasonably concentrated solution. Calculating the exact concentration is NOT necessary.
- To do a flame test with each metal salt, get a film of the solution on a wooden splint and bring it into the hottest part of the flame. To avoid contamination, use a different splint for each test solution. If this produces poor color, then try the edge of the burner flame. Repeat the test as often as necessary to see the flame test color. Be sure not to overheat the splint.
- In your notebook record the name of each compound and the overall color of each when it is put in the flame.
Part 2. Computer Simulation—Neon Lights and Discharge Lamps
After this computer simulation you should be able to 1) explain how discharge lamps function, 2) discuss the emission of photons from these lamps in terms of an atomic model, like the Bohr model, 3) compare and contrast the emission of photons from different lamps.
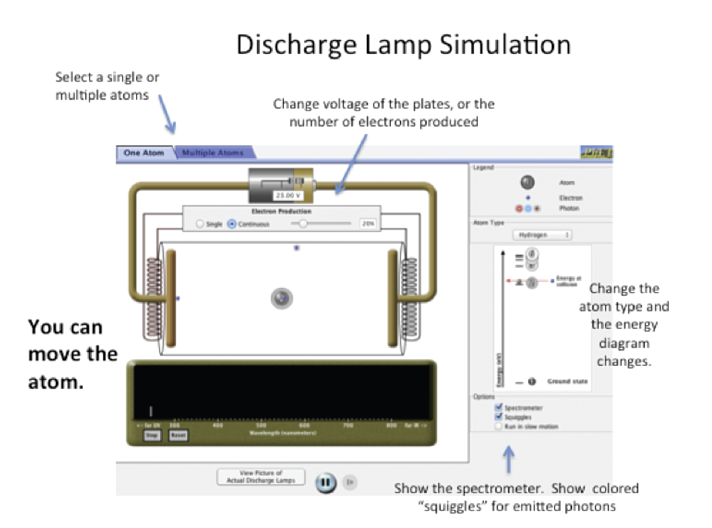
To begin your investigation start the simulation and take a few minutes to click on different things; see what you can adjust, change, and observe. You may want to start by clicking on “Fire Electron” (it sounds impressive). A few other suggestions are given in the figure.
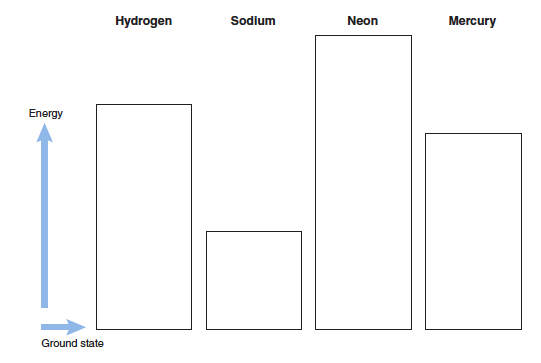
Sketch the electronic energy levels for each atom in the appropriate box.
To see the electronic energy levels click on “Atom Type” and select the desired atom. Notice how the energy levels are quantized and only the lowest energy level has an electron. This is because excited state electronic energy levels are being shown. The energy level at the bottom (lowest potential energy) where the electron initially resides is the highest energy level of the ground state.
What is the electron configuration for each atom in its ground state?

What are allowed quantum numbers (n, l, ml, and ms) for the most energetic electron in the ground state? (Sodium is done as an example.) This is the electron shown in the “One Atom” tab of the simulation when in the ground state.

By having electrons strike the atom you can cause it to emit photons, and the energy of the emitted photons is recorded by the spectrometer. The electron production can be single or continuous and the voltage may be adjusted (see the top of the screen, as shown in the figure). You must turn on the spectrometer to record the emitted photons (right side of the screen). In the “Atom Type” pull-down menu you can configure (move) the energy levels and also add energy levels, or choose a particular element (like neon).
Start producing electrons and use the simulation to gather information and answer the following questions.
Select the ONE ATOM tab.
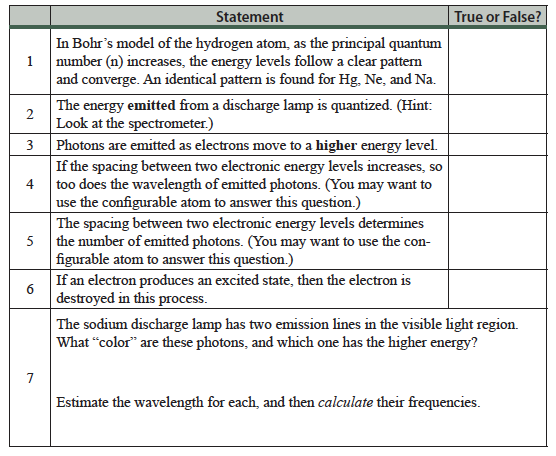
Can an emission spectrum be produced from a single neon atom? (The answer is “yes.”)
The emission spectra for single atoms of hydrogen, mercury, or sodium occur “automatically” in this simulation. This is not the case for neon. Try to manipulate the different simulation variables (e.g., voltage) and figure out how to produce the Ne emission spectrum.
Why is it more difficult to cause photons to be emitted from neon?
Multiple Atom Tab
Obviously, a discharge lamp contains more than a single gaseous atom. What happens when more atoms are present? To find out, select the MULTIPLE ATOM tab.
Do you think the spacing of the electronic energy levels will be the same or different when comparing the single atom with multiple atoms? Make an initial prediction:
Now use the simulation and compare the spacing of the energy levels for a single atom with those of multiple atoms for each element. Revise your prediction if you were incorrect.
Now consider what happens when electrons begin to travel plate-to-plate, striking the gaseous atoms. Make initial predictions regarding what will be the same or different when the number of atoms increases.
- I predict ____________ will be the same when one atom or multiple atoms are present and electrons begin to travel plate-to-plate.
- I predict ____________ will be different when one atom or multiple atoms are present and electrons begin to travel plate-to-plate.
After making your initial predictions, use the simulation to investigate whether an increased number of atoms affect the following and, if so, describe how.
- The output of the spectrometer
- The interactions between atoms, electrons, and photons in the discharge lamp
- The population of energy levels by electrons
Ionization Energy
In this simulation you have added energy to atoms in their gaseous state causing electrons to move to excited states. What if even more energy was added to an atom in its gaseous state? Would it be possible to completely remove an electron and form an ion? YES!
The ionization energy of an atom or ions is the amount of energy required to remove an electron from the ground state of the isolated gaseous atom or ion. For sodium, the first ionization energy is the energy required for the process:
What is the electron configuration for each ion after an electron is removed?

Consider the first ionization energies for different atoms shown in the figure (left) and the electronic energy level diagrams from the simulation (right).
Describe the relationship between these two.
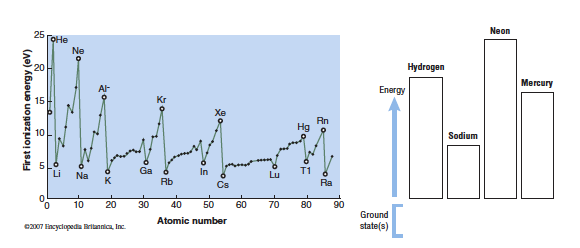
Based on your previous answer, do you think the excited state electronic energy levels will be the same or different for Li, Na, and K (moving down a column in the periodic table)? Explain your reasoning.
Do you predict the excited state electronic energy levels will change moving from Li to O to Ne (across a row in the periodic table)? Explain your reasoning.
The first ionization energy exhibits a periodic trend that may be explained in terms of differences in effective nuclear charge. Return to your flame test observations. Do they also exhibit a periodic trend? Explain why there is (or is not) a periodic trend. A complete answer will combine your experimental observations with insights from the computer simulation. This is not an easy question! Discuss your response with classmates and the teaching assistant.
