Chapter 1. LAB 1 Scientific Communication I: Questions, Data & Conclusions
Learning Goals
- Understand how to take accurate and precise measurement data and how to present data in figures and tables
- Know the distinction between quantitative and qualitative data
- Analyze data to search for patterns, read specialized graphs and explore the conclusions that can logically be drawn from them
- Understand how to critically distinguish conclusions from sources of error or variability, and from data collection limitations
- Learn a systematic approach to reading scientific literature
- Plan a multi-week scientific literature project
Lab Outline
Activity 1: The Process of Science
1A: Growth in Woody Plants
1B: Leaf Morphology
Activity 2: Locating Scientific Literature
Activity 3: Applying the Reading Strategy
Activity 4: Scientific Literature Project
1.1 Scientific Inquiry

Experiments on Drip Tips
Leaves in wet tropical habitats commonly have simple leaf shapes with “drip tips”. Could this mean that drip tips have adaptive value in this habitat? Plants in dense, wet tropical environments have to compete for light so the leaves are adapted for capturing and competing for light. Water on the surface of leaves tends to reflect light away from the photosynthesis cells in leaves so Lightbody (1985) and Dean and Smith (1978) studied the effect of the presence of drip tips on the ability of tropical leaves to shed excess water. Lightbody’s experiments (Figures 1, 2, and 3) were conducted on the genus Piper, and Dean and Smith’s experiments used the species Machaerium arboretum. In both sets of experiments the control leaves were left intact with their drip tips while the experimental leaves had drip tips removed. The investigations documented leaf shape characteristics and water shedding measurements taken on plants living in either wet or dry habitats.
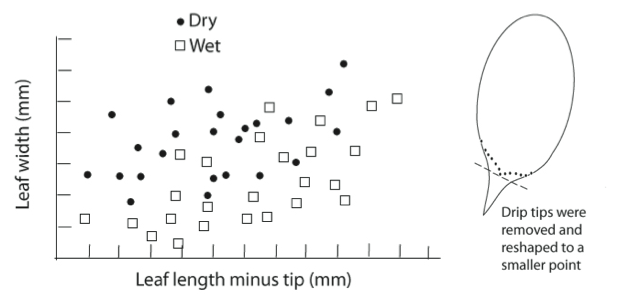
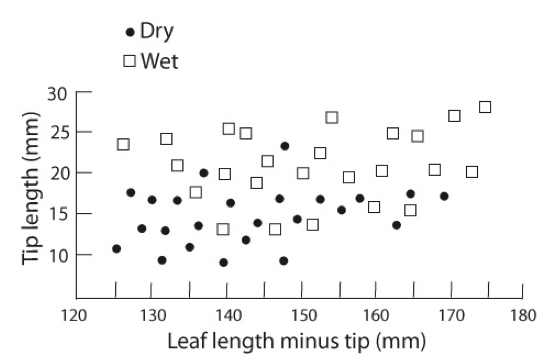
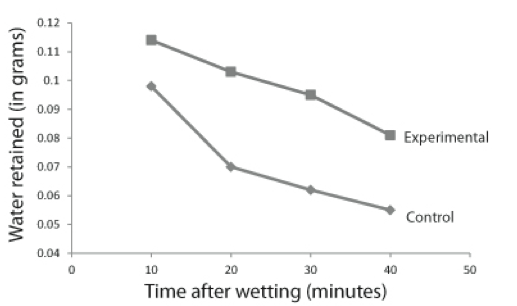
Notice that the researchers presented their data in graphical form (Figures 1, 2, and 3 were modified from Lightbody 1985; Dean and Smith 1978). The graphs in Figures 1 and 2 are called scatter graphs which compare two sets of measured data for the same object, such as leaf length (X-axis) and leaf width (Y-axis) for each leaf measured. There are many values for the length-width measurements of the leaves which create a scatter of data points, hence the name “scatter graph”. The graph in Figure 3 is called a line graph and relates continuous data, in this case changes in the variable, “amount of water retained,” over time.
How would you attempt to read a scatter graph? First, read the axes labels and note what variables are being compared to each other. Next, read the graph key to determine if there is additional information provided about the data points. In Figure 1, the comparison is made between leaf length (with the drip tip removed) and leaf width. Based on the key, these measurements were taken on leaves from two different habitats, wet and dry. As you study the data points, do you see a trend? For example, how would you characterize the relative shapes of leaves from wet vs. dry tropical habitats? Are thin and long leaves more common in wetter or drier habitats?
In Figure 2 the axes are set up to show the relationship between leaf length (with the drip tip removed) and tip length. Are the drip tips longer in wet or drier habitats? Is there a positive relationship between drip tip length and leaf length, i.e. does drip tip length increase as leaves grow longer? What other information might be helpful for interpreting Figures 1 and 2. Would a best-fit line for each microhabitat provide useful information? Figure 3 shows the relationship between weight and time for control and experimental leaves. Does this relationship appear to be linear for both types of leaves? Which kind of leaf, control or experimental, sheds water faster?
Finally, presentation of the data in graphs allows us to visually view the results and quickly draw conclusions about the distribution of longer drip tips and the role drip tips play in facilitating water shedding in wetter habitats. The clarity of data presentation is critical when communicating findings in science such as those by Lightbody (1985) and Dean and Smith (1978), but it is also important for you as a student when you report findings from experiments completed in a lab course.
1.2 Background
The Process of Science
As a biology student you have to learn many scientific facts, but just as importantly, you need to learn how science is conducted and validated. Most scientific investigations inevitably involve counting or measuring things and patterns or trends in data can be detected using data analysis such as statistics and graphs. These patterns then may lead to further scientific questions and experimentation. When significant findings are made this information is communicated to the scientific community, and anyone with an interest in the subject, in peer-reviewed scientific journal articles. This lab will introduce you to a simple approach to a scientific investigation and to the science information superhighway—you will learn a method for reading and comprehending scientific literature. Both of these are basic to the process of science.
You will take measurements on plants that can be interpreted from diverse perspectives. Plants play vital roles in the survival of life on earth—we rely on plants for food and oxygen, as habitats, and as the structural framework for ecosystems. Many common plant structures have evolved adaptive functions far beyond their basic roles in support, photosynthesis, nutrient and water transport, and reproduction. Because of its vital role in our lives and the environment it is not surprising that plant sciences are extremely important fields of biology. During this lab you will make observations as if you were a plant biologist or botanist investigating plant growth and survival.
Since this is an introduction to scientific investigations we will collect data to detect patterns that potentially lead to different hypotheses about plant structures and their adaptations. When scientists doing specialized research find results of their experiments that are well supported with solid evidence they submit this information in papers published in scientific journals. These papers are subjected to a scrutiny process known as a “peer review” in which experts in the field critique a submission to a journal and decide whether it is worthy of publication. Scientists are aware that even in the midst of this careful process, new facts and insights may come to light that change our current understanding, render old premises obsolete (but not necessarily invalid), and lead to new models and conclusions.
To understand and perhaps eventually join a community of scientists, you must develop an understanding of the reasoning that leads to good scientific research and skills in reading, interpreting, and thinking critically about scientific information. It takes time to learn enough to conduct your own research on a particular subject, but your success will improve dramatically if you develop the ability to read scientific papers, criticize them, devise your own experiments, and communicate your results.
1.3 Scientific Literature Project
The BIO 204 “Sci Lit” spans several weeks. Activity 2-4 in today’s lab will prepare you for the assignments that make up the project.
- In Activity 2, you will locate scientific journal articles using library databases.
- In Activity 3, you will learn to read these articles using a reading strategy. This is a stepwise process designed to train you to quickly determine the salient points of scientific papers. These activities will prepare you to deliver a formal presentation on a research article later this semester.
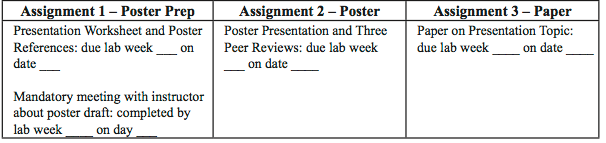
- In Activity 4, you will learn to plan and outline an oral presentation of a research article using a specially designed worksheet that will help you organize the main points in a paper. About a month from now you will present your article in class to your peers and receive constructive feedback from them to help you improve your presentation. Finally, you will write a paper that summarizes the research article, what you learned from it about science, and future directions this kind of research might take. Follow the schedule below for the scientific literature project:
Schedule of Assignments for the Scientific Literature Project
1.4 Resources
Brookhaven National Laboratory (BNL) Meteorological Services. Monthly Climatology. http://www.bnl.gov/weather/MonthlyClimatology.asp Accessed 2012 June 22.
Dean JM and Smith AP. 1978. Behavioral and Morphological Adaptations of a Tropical Plant to High Rainfall. Biotropica, Vol. 10 ( 2): 152-154
JP Lightbody. 1985. Distribution of Leaf Shapes of Piper sp. in a Tropical Cloud Forest: Evidence for the Role of Drip-tips . Biotropica, Vol. 17 (4): 339-342
University of California Museum of Paleontology. 2012. “How Science Works.” Understanding Science. http://undsci.berkeley.edu/article/howscienceworks_01 Accessed 2012 June 22.
Wilson, CL, Loomis, WE. 1957. Botany, revised edition. Holt, Rinehart, and Winston, Inc., NY. pp.528.
1.5 Lab Preparation

Watch the vodcast and read this lab. Place all notes in your lab notebook. Review the Course Information located at the beginning of the Lab Manual. There will be a Pre-Lab Quiz on this information.
1.6 Activity 1: The Process of Science
Activity 1A: Exploring Primary and Secondary Stem Growth
How does a seed like an acorn grow into a tree? After the acorn germinates in the ground it grows longer and thicker. We call increase in length primary growth and increase in thickness secondary growth. Plants that increase in height or length experience primary growth but it is mainly members of the seed-bearing flowering plants and certain seed-bearing non-flowering plants that undergo secondary growth.
In primary growth, the plant lengthens and branches the shoot (leaf and stem) and root systems. Plant stems increase in thickness by layering new woody tissue to the outer portion of the stem which causes an increase in stem girth. This secondary growth consists of wood and bark, which continues to thicken around primary growth throughout the life of the plant.
In temperate climates growth ceases during the winter and resumes in the spring. When growth slows and ceases as winter approaches, the hard bud scales that protect the tender growing apical meristem cells at the tip of the stem leave a bud scar, a kind of footprint, in the bark of the twig. At the end of each growing season the bud scars along the length of the twig show where growth ceased. The distances at every interval between the tip of the twig and the bud scar, and from that bud scar to the next are records of the amount of primary growth in a given year (Figure 4A). Also, when the leaves fall off the twig they leave an impression called a leaf scar at the base of lateral buds.
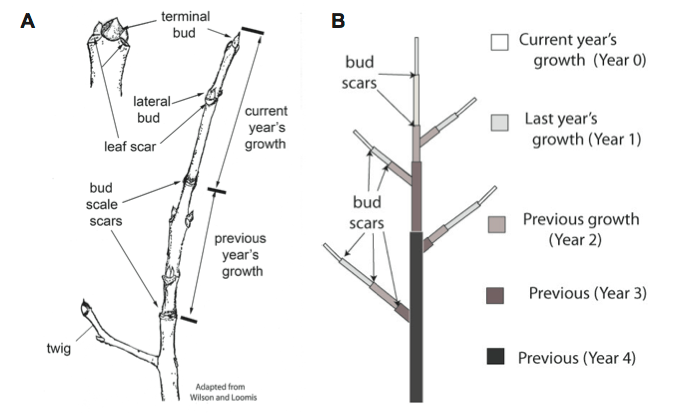
Notice the current year’s growth (in white) is narrow corresponding to the diameter of the bud at the end of the twig (Figure 4B). Each year’s growth is separated by bud scars that mark the position of the bud at the end of a growing season. The older portions of the twig no longer grow in length but they do grow in thickness and each year another layer of secondary growth is added to the twig. This pattern of second- ary growth creates the tree rings seen in cut logs. After a while the bud scars are no longer visible when secondary growth layers cover the position of the original bud scars.
Since bud scars can be used as markers for measuring the amount of primary growth this year and in previous years, we can use these measurements to compare growth from one year to the next. In the next activity you will use a branch from a tree to measure differences in primary growth between this year and previous year’s growth.
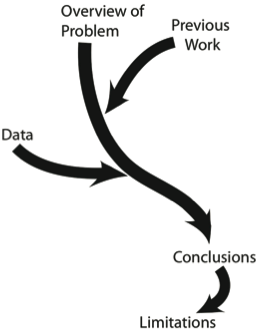
This inquiry into primary growth will touch upon some of the major steps required when one is conducting a scientific investigation. You will observe and take measurements of part of a living thing to devise questions (Overview of Problem), you will use terms and background information defined by plant biologists (Previous Work), you will collect data, process it, and interpret it (Data), and finally you will draw some conclusions from your findings that are in line with what is known about the system (Conclusions). We hope you will also learn that the conclusions we draw may not be the final answer (Limitations). As stated earlier, the process of science basically tests hypotheses with evidence to formulate scientific explanations that are logical and persuasive, explanations that are also constantly reviewed with additional evidence and revised.
1.7 Learning Objectives
After successful completion of this activity, you should be able to:
- Measure yearly primary growth in a woody plant
- Collect quantitative data in a table and graph the data in EXCEL
- Draw conclusions from a graph of data
Materials
Tree branches from different plant species
Rulers
Tape measure
Calipers
1.8 Procedure
- Observe primary and secondary growth in a branch from a tree (Figure 4). How many bud scars are present along the length of the main or apical branch? Sketch the branch and its accompanying lateral branches in your lab notebook. Indicate the positions of the bud scale scars on the apical branch.
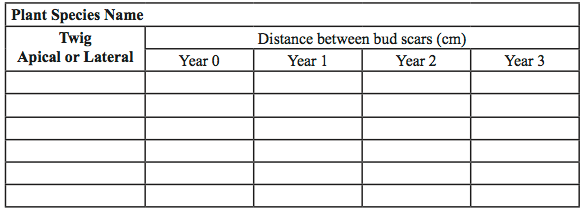
- Measure the distances between each bud scale scar and enter this data into a data table in your lab notebook, similar to Table 1. Write in detail how you took your measurements and the instrument(s) used so the method is reproducible. Do not confuse bud scars with leaf scars, if you do, your data will not reveal information about primary growth.
- Repeat your method and take similar measurements of at least two other lateral branches. Note which group members measured which branches. Why is this important?
Table 1 Primary Growth Data
1.9 Data Analysis
Additional Information about Excel is available in the Appendix of your Knisely Writing text.
- Enter your data into an Excel spreadsheet. Open EXCEL on your computer, click on the Home tab and enter your data in the rows (numbered) and columns (letters) in an EXCEL spreadsheet.
- Create a scatter graph of your data. Highlight your data to select it by clicking on the upper left most part of the table and while holding down the left mouse key, drag the highlight box across the entire data table. Click on the Insert menu tab, and in the Charts ribbon menu select Scatter. In the Scatter drop down menu, select “scatter with only markers.”
- Check that your data is graphed properly. Once the graph appears, move and resize it as necessary. If your graph appears without a proper “key,” Excel may have graphed your data across, by rows, instead of down, by columns. To check, click on the graph Chart area to select it (it will also box-in the data used to make the graph) and a Chart Tools menu will appear. Click on the Design tab and select “Switch Row/Column” in the ribbon menu. Toggle the selection on and off and note what happens to your graph and how the data highlight changes.
- Properly format your scatter graph. The graph appears as the Excel default form which is usually not appropriate for lab reports. To convert it to the format required for your reports you have to remove the grid lines and border, add in axes titles, and a figure legend. The key in the graph is called a “legend” by Excel, but it is not a figure legend as it is known in science, but a key like that on a map.
a. Right click on the gridlines to highlight them and select Delete, in the menu that appears, to remove them.
b. Add axes titles. Click on the graph to activate the Chart Tools menu again. Select the Layout tab and then Axis Titles in the ribbon menu. Choose an axis to label from the drop down menu and select a position to place the title. Click in the Axis Title box or Formula Bar and enter a title like “Growth Year” for the x-axis. Do the same for the title for the y-axis, but select Rotated Title so the title is positioned vertically.
c. Change the markers on your graph. You can use many of the Chart Tools to make modifications to your graph. For example, you might prefer a different symbol to the default symbol.
d. Right click on different parts of the graph to access menus directly. You can make changes to your EXCEL graphs by right clicking directly on the Chart Area, Plot Area, or markers (data points) and Excel menus will appear related to what you clicked on. To remove the graph border, right click on the Chart Area and select “format chart area.” Click on “Border Color” and select “No line.”
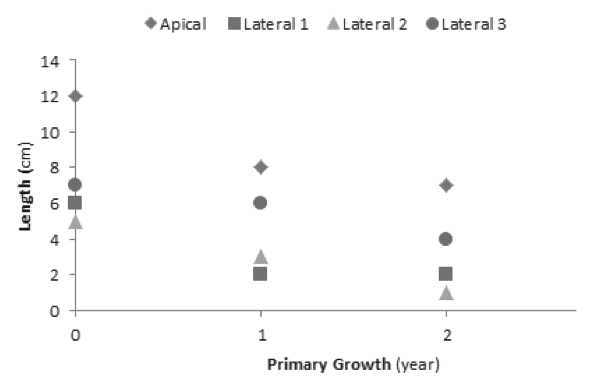
- Add a text box into which you will type a figure legend. The figure legend should be descriptive of the results. The figure legend should allow the reader to interpret the graph without having to read the methods or written results. Please note in the final version of the graph the key was moved to the top of the Plot area to spread out the graph. Your graph should look similar to Figure 5.
- Interpret your data based on the graph.
a. What conclusions can you draw from each set of data?
b. What could account for similarities and differences in the amount of primary growth of the twigs on your branch? For example, compare the relative amount of growth of different twigs growing on the same branch. For example, does lateral twig 1 give the same growth rates as lateral twig 2?
c. Did the apical twig on your branch grow more than the lateral twigs? It did in our hypothetical example? If so, what could make the apical twig grow more than the others?
d. What other factors could have influenced our results? Are there environmental effects such as sunlight exposure that results in more or less primary growth on the sunny side (south facing) vs. the shady side (north facing) of a tree?
e. Make definitive statements about the relative amounts of primary growth in the twigs on the branch and based on your basic knowledge of primary growth propose hypotheses about the reasons why the twigs have different or the same amount of growth. What types of information would be helpful in supporting or refuting your hypothesis? For example, there is Long Island Climate data available on the Brookhaven National Laboratory (BNL) Meteorology site; would this information be critical to substantiate a hypothesis?
- Write some conclusions you can draw from your data. What limitations did you encounter in your ability to draw definitive conclusions? This is a common issue in the process of science.
- Would you be able to figure out how old the tree is from this branch?
a. Speculate as to why the branch grew to the length it is at now?
b. Speculate about the determining factors that decide the size of a branch? What is known in your textbook about how “branches grow?”
- In your lab groups, think of a question that can be asked regarding the two different types of growth. Each lab group will pose their questions to the class for the discussion.
1.10 Activity 1B: Exploring Leaf Morphology in Flowering Plants
Does the shape of a leaf impact its survival? For example, leaves are flat, there aren’t any spherical (ball-shaped) leaves. Since photosynthesis is the primary function of leaves, flat leaves are adaptive. Flat leaves collect more light and can exchange carbon dioxide and oxygen better than a cube-shaped leaf would. But what about the two-dimensional shape of leaves? Some are long and thin, others are wide, some have smooth edges, and some have jagged edges. What background information would you like to know about two-dimensional leaf shape that might tell you something about its relationship to plant adaptations?
Learning Objectives
After successful completion of this activity, you should be able to:
- Categorize leaves from temperate and wet tropical forests based on their morphology
- Collect and code qualitative data
- Tabulate data in a scientific format
- Interpret a data table and use the information to draw conclusions
Materials
Leaves from Stony Brook Campus Plants
Pictures / Traces of leaves from wet tropical rainforests
1.11 Procedure
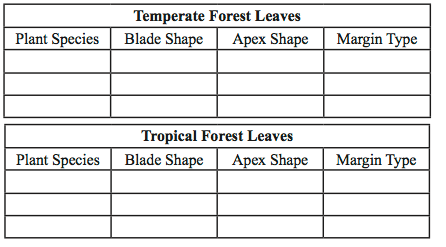
- Create a data table similar to Table 2 in your lab notebook.
- Collect four temperate leaves and four tropical leaves from the samples provided in the lab.
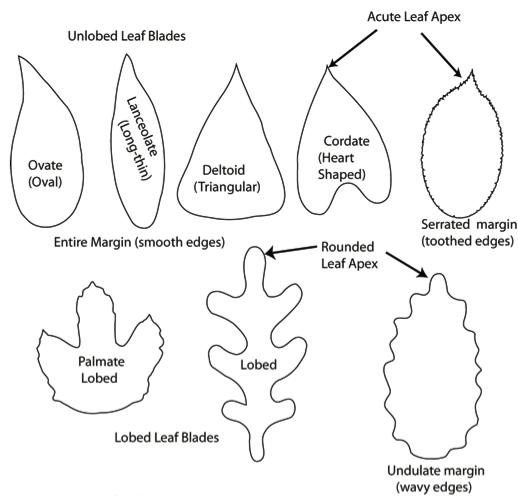
- Observe the overall leaf architecture (Figure 6) for each leaf.
- Collect qualitative data on each leaf in your data table by noting the following characteristics: leaf blade shape (ovate, lanceolate, deltoid, cordate, lobed, or palmate lobed), leaf apex shape (acute or rounded) and leaf margin type (entire, undulate, or serrated).
1.12 Data Analysis
- Transform your qualitative data into reference values. For example you may choose to use numbers as follows: (e.g., cordate = 1, deltoid = 2, etc.).
- Enter your coded information into an Excel worksheet.
- Compare your coded table with your table of labels in your lab notebook. Is it easier to compare the leaves for the characteristics using the coded values instead of the actual label names? Should you change the arrangement of either table so that they are easier to read for making comparisons across leaf species?
- What do you notice about leaves from tropical areas versus leaves from the temperate climate of Long Island?
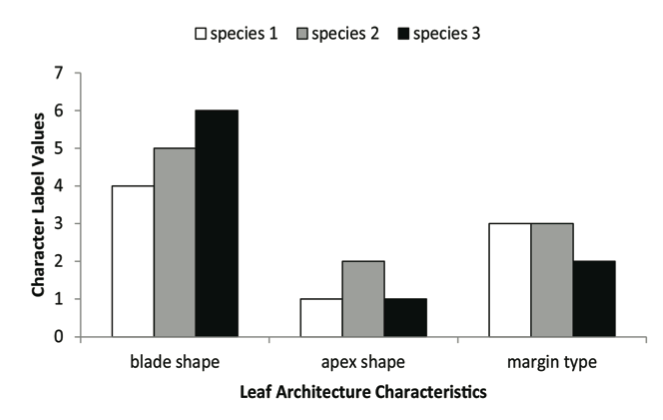
- Is it appropriate or helpful to graph this data? Explain? Look at the sample graph shown. Can you easily determine whether there are differences or similarities between the temperate species listed?
- Interpret your data. Are there any leaf shape similarities or differences that you can use to distinguish leaves from temperate vs. tropical rainforests?
- What questions came to mind as you compared the data for leaves from two different habitats. State at least one hypothesis that addresses one or more of these questions?
- Write down the steps you would take to produce evidence to support this hypothesis.
1.13 Activity 2: Locate a Scientific Literature Article through Library Resources
Learning Objectives
After successful completion of this activity, you should be able to:
- Search for articles using scientific databases
- Locate a specific peer-reviewed journal article in library eJournals
Materials
Computer with access to on-line electronic journal articles
Selected Scientific Literature Project Paper
1.14 Procedure
- Review how to search scientific databases for articles through the Library Research Guide tutorial modeule 4: finding articles at http://www.library.stonybrook.edu/tutorial/index.html. You can also view the Research and Subject Guides for the Life Sciences—Biological Sciences on the SBU Library website. You will be responsible for mastering this skill.
- Select one of the 24 research paper topics from the number bin. Type your name next to the topic you chose on the class topic spreadsheet.
- Write down the reference for your assigned poster project paper. Rewrite the reference according to the Knisely Name-Year Format in your lab notebook. This is the format you are required to use for all course assignments for which you use citations. Note the name of the Journal in which your article is found, the year, volume number, and page numbers. Ask your instructor for help if you are not sure.
- Open an Internet Browser on the lab computer and go to the SBU Frank Melville Jr. Library website. Click on the “E-Journals” tab on the homepage of the SBU Melville Library site.
- Search eJournals. Type the title of your Journal in the search window or select it alphabetically if you click on the link to the eJournals Home page. If your journal title is abbreviated, the search engine may or may not recognize that abbreviation. You can search the internet for the full journal title and its spelling. There are sites that will give you the name of scientific journals based on their abbreviations. Test your SEARCH skills to find these sites.
- Find the journal and the correct journal volume. If your journal article citation is “Kilpatrick AM et al. 2006. Predicting the Global Spread of H5N1 Avian Influenza. PNAS 103(51): 19368-19373,” you can search for PNAS in the E-Journals database.
- Select the link that most likely contains your article (i.e., it covers the year of interest) if there are several links to the journal. Once you enter the PNAS site, find the correct volume (and in this case, number) of the journal. Select the link to go to that volume.
- Find the article. Select the article from the journal volume based on the page number, the authors’ names, and the title.
- Save the article to your flash drive by clicking on the PDF link to the journal article until the article appears in the same format as it appears in the published “paper” version and then saving the PDF to your flash drive. Alternatively you can try right clicking on the PDF link to save it without opening it first. Check that the article saved and that your citation information for your paper is correct based on your printed version.
- Locate additional information about your paper topic by referring to the literature cited section of your article.
- Try the Library Databases to locate more articles with background information on your topic. You can search the numerous Biological databases such as Annual Reviews, Biological Abstracts, JSTOR, etc.
- Check the Library Card Catalog for scientific books on your topic.
1.15 Activity 3: Survey and Read a Scientific Literature Article
Reading Strategies (aka The Secrets of Successful Reading)
Reading with excellent comprehension is necessarily a highly developed skill for academic and professional success. Expert readers can successfully comprehend what they are reading through “directed cognitive effort”, or the conscious awareness of “procedural, purposeful, effortful,” and willful attention to monitoring their understanding of what they read (Taraban, et al., 2004). It may come as no surprise to you that highly trained professionals master certain “tricks of the trade” that make reading professional literature needed for their work more efficient—these “tricks” are called “reading strategies” or “reading methodologies”, among other terms. The idea is to use specific, ingrained reading habits to quickly and efficiently learn information from written work. As a pre-professional student you will benefit tremendously from mastering a reading strategy for professional literature.
The Reading Strategy for Professional Scientific Articles
Primary scientific literature is written in a specific format to convey information efficiently. Here are a couple of examples of strategies for reading professional articles:
- Read the Abstract — Modern journals require a structured abstract that contains the background (hypothesis), methods, results and conclusions. This provides basic information and does not enable you to think critically or analyze the validity of the content.
- If the article has an Abstract, start by reading the conclusion section of the abstract— the idea here is to learn what the author thinks is the most important outcome of the article.
- Read the Topic Sentences (the first sentence) of each paragraph. — If the paper is structured in standard format you can get a sense of the point of the article just from the flow of the ideas derived from these topic sentences.
- Read the Title — a well written title will describe the essence of the paper in a few words and provides key words to use in search engines for additional information.
- Outline the paper and Define unfamiliar terms—to get an overview of the paper.
In BIO 204 we present a standardized reading strategy (Table 3) to aid novices with interpreting scientific articles written in the biological sciences. You should apply this reading strategy to learn its major steps and practice your own version of this strategy to develop “specific ingrained reading habits” that allow you to quickly and efficiently glean information from scientific literature. Efficient use of any reading strategy requires a degree of practice before this skill is mastered—in the following activity you will start your practice with an in-class paper.
Primary Literature Project in BIO 204
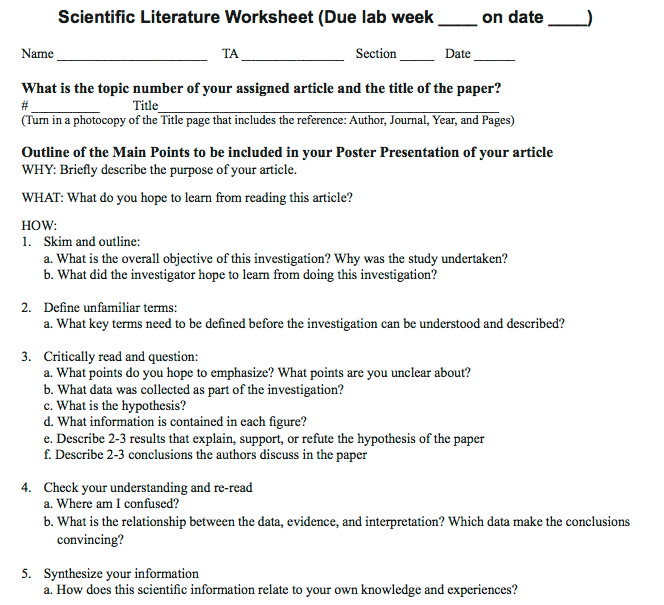
Over the next few weeks, you will apply the reading strategy to an assigned primary literature article. You will complete a worksheet based on this strategy to help you identify the major points of your paper and its critical results and conclusions in preparation for your poster and oral presentation.
1.16 Learning Objectives
After successful completion of this activity, you should be able to:
- Read scientific journal articles using a reading strategy
- Identify the purpose of an experiment
- Find the methods used in the experiment
- Locate the evidence described in results
- Explain the conclusions drawn in primary literature articles
Materials
Knisely text
A primary literature article
1.17 Procedure
- Locate an article based on the citation provided by your instructor. Save a copy of the article to your flash drive.
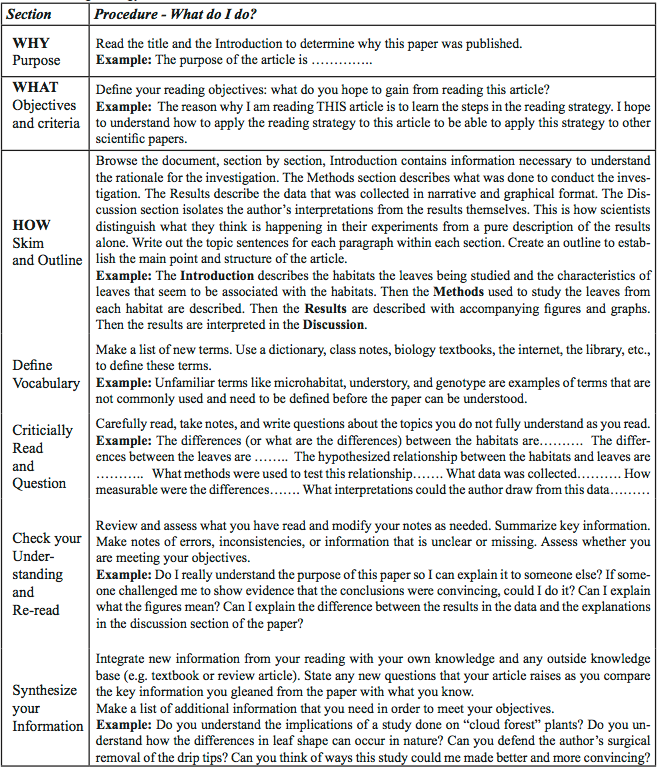
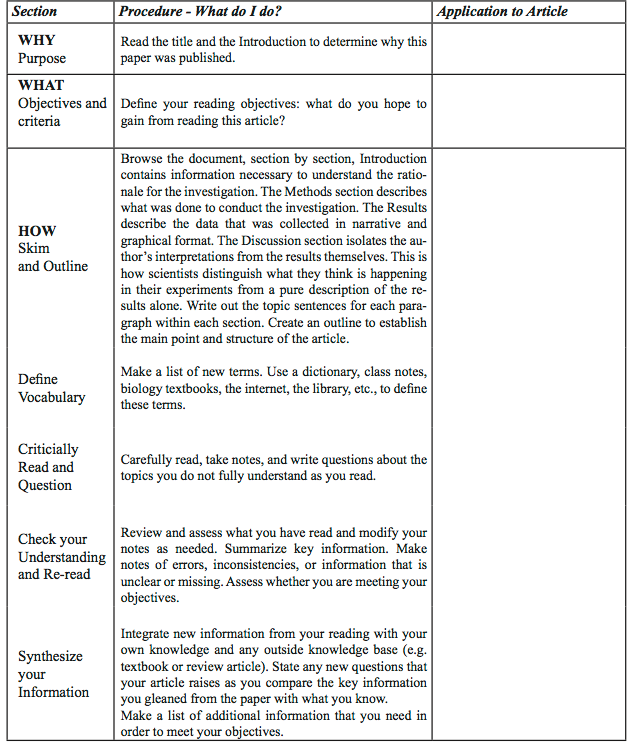
- Follow the reading strategy presented in Table 3. Complete the “Why” and “What” sections of the strategy.
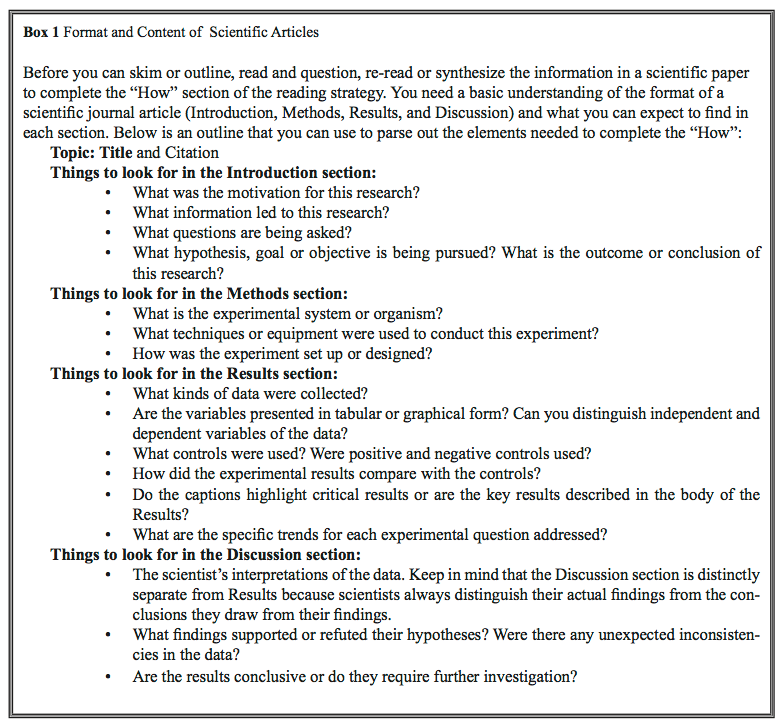
- Complete the parts of the “How” section as designated by your Instructor (Table 4). Completion of the “How” section requires an understanding of the “format” of a scientific article (Box 1).
1.18 Applying the Reading Strategy
Compare the steps in the strategy with information in the Lightbody, (1985) article to see the correspondence between these steps and an actual article.
Table 3 Reading Strategy
1.19 Applying the Reading Strategy
Compare the steps in the strategy with information in your assigned article.
Table 4 Applying the Reading Strategy
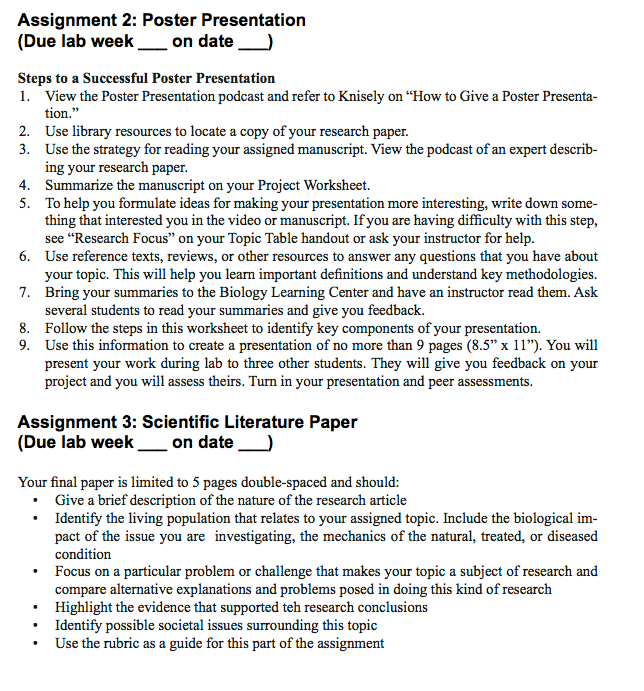
1.20 Activity 4: Poster Presentation Plan
In this activity, you will make a plan for your poster presentation including a schedule of due dates. You will be given the reference to a particular paper to locate using library resources. Each student in your lab will present a different paper —these papers cover a wide range of topics.
In this activity you will make a plan for your poster presentation according to a schedule of due dates. You will be given the reference to a particular paper to locate using library resources. Each student in your lab will present a different paper —these papers cover a wide range of topics.
1.21 Self-Assessment
These questions were taken from previous exams and are meant to represent a sample, not a complete study guide. The questions in these examples are designed to test your understanding of the concepts and skills presented in this lab, and your ability to apply what you have learned to novel problems.
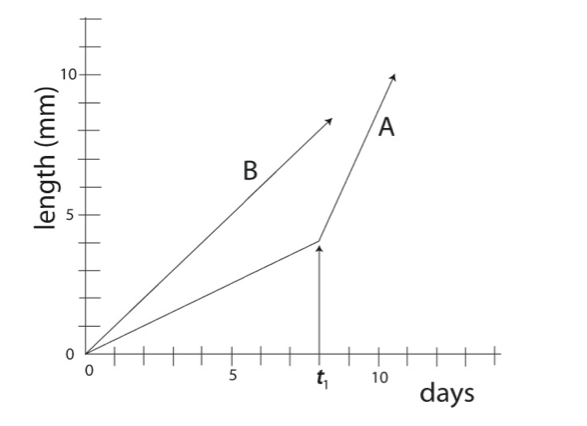
1.
Computation: Compare the growth rates of plants “A” and “B”.
a. Calculate the growth rate of “A” before t1.
b. Calculate the growth rate of “A” after t1.
c. Calculate the growth rate of “B”.
2.
d. When will “A” and “B” reach the same length?
3.
e. What do you think might have happened at t1?
4.
LOC: Based on what you have learned in BIO204, answer the following question. You are at a scientific conference to present preliminary research data in a poster. You state the hypothesis in your _____________ and you present ____________ in the Results section. You would include future directions of your research in the ____________.
| A. |
| B. |
| C. |
| D. |
| E. |
5.
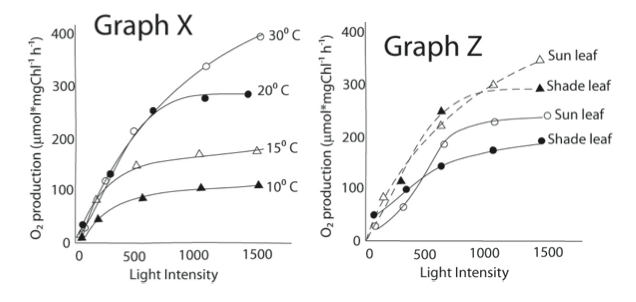
HOC: Two experiments were conducted on leaves from the same tree. In the first experiment, oxygen production was compared under different temperature conditions. In the second experiment, oxygen production from sun exposed leaves and shaded leaves from the same tree were compared. Given the photosynthesis data in Graphs X and Z interpret the differences between the data graphed with dashed lines and data graphed with solid lines in Graph Z. Which of the following is FALSE?
| A. |
| B. |
| C. |
| D. |
| E. |