Chapter 2.
Three-Phase Model of Matter
Practice Question 1
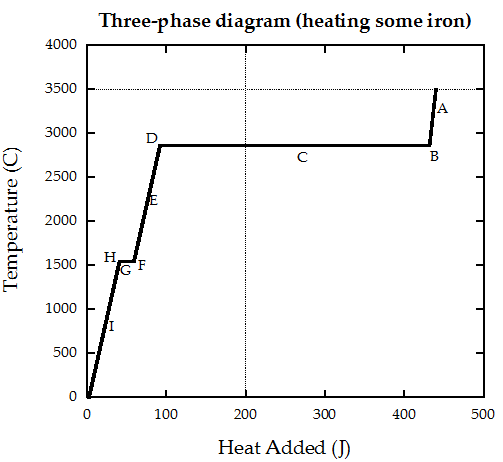
A solid chunk of iron is heated up until it is 600°C below its melting point. At which point on the diagram might the iron lie after this process? Explain how you know this.
Practice Question 2
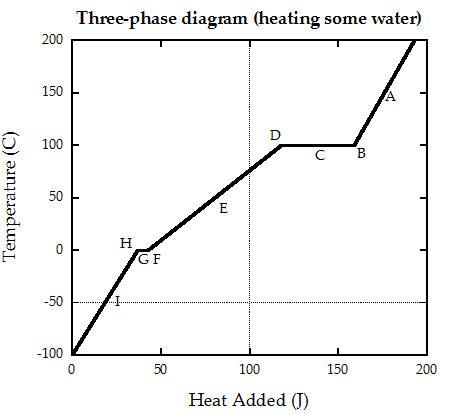
Water is placed in a sealed container and heated until half of it is turned to steam. At which point on the diagram might the water lie after this process? Explain how you know this.
Practice Question 3
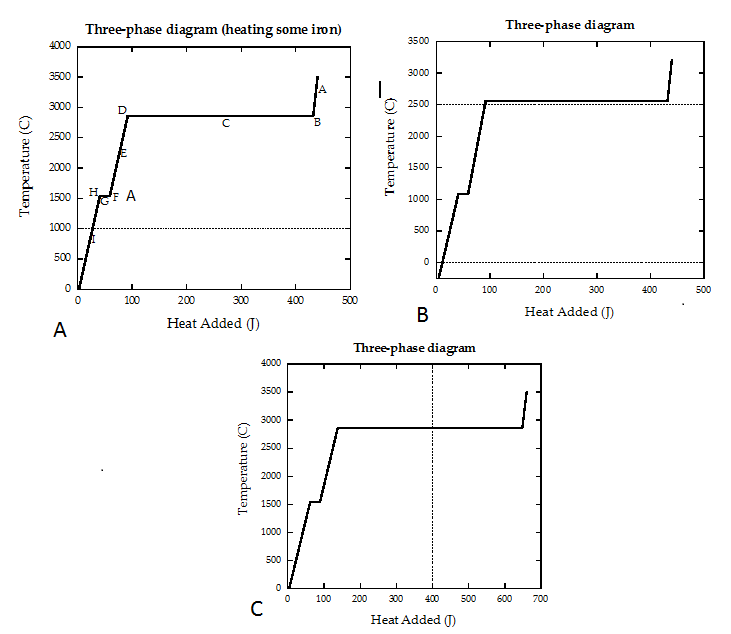
A three-phase diagram (Diagram A) for pure iron is shown to the right. Two more three-phase diagrams (B and C) are also shown to the right. B is the same as A along the horizontal axis and C is the same as A along the vertical axis. Could B or C (or both) also represent the Temperature vs Heat Added for some block of pure iron? Explain.
Practice Question 4
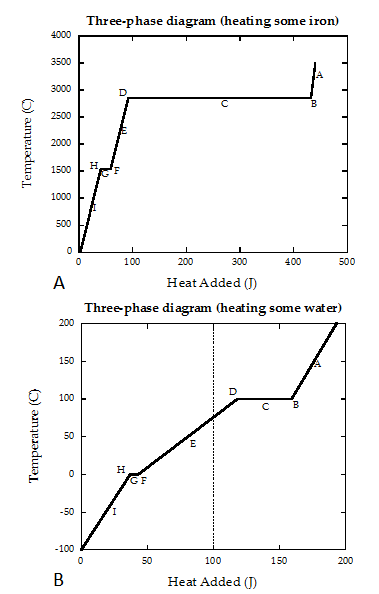
A block of iron at Ti iron = 750ºC is placed on top of a block of ice (solid water) at Ti water = -50ºC in an insulating container so no heat can be transferred into or out of the container. Three-phase diagrams for iron (Diagram A) and for water (Diagram B) are shown to the right.
For the situation described above:
a) what letter is closest to the starting point of the iron? Explain how you know.
b) what letter is closest to the starting point of the water? Explain how you know.
c) does the iron move up and to the right along its heating curve or down and to the left along its heating curve? Explain how you know.
d) does the water move up and to the right along its heating curve or down and to the left along its heating curve? Explain how you know.
e) suppose 20 J of heat is transferred from the solid iron to the water as these two materials came to equilibrium. What would the approximate equilibrium temperature of the iron be? Of the water? Explain how you know these.