Taking Measure: Precious Metals and the Spanish Colonies, 1550–1800
Printed Page 503
Important EventsThe graph shows that the production of gold and silver spurted upward between 1550 and 1590 and then declined until the beginning of the eighteenth century, paralleling the inflation of the last half of the sixteenth century and the following period of decline and depression. The graph also makes an important distinction between what was produced in the colonies, what was imported into Spain, and what the Spanish crown actually got as its share.
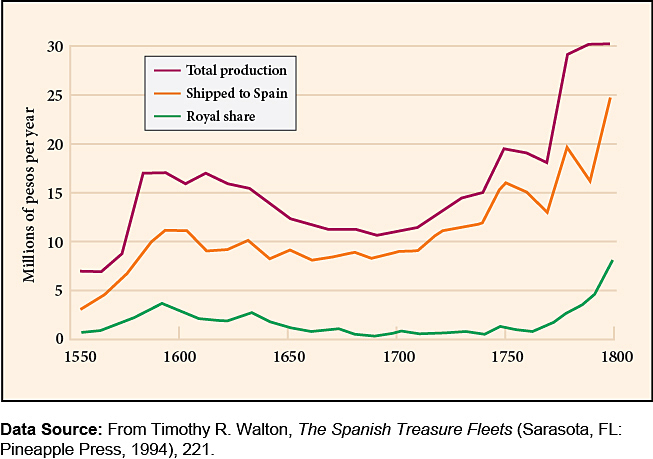
Source: From Timothy R. Walton, The Spanish Treasure Fleets (Sarasota, FL: Pineapple Press, 1994), 221.
Questions to Consider
- What can we conclude from this graph about the resources available to the Spanish king?
- How is the decline after 1590 related to the economic downturn of the early 1600s?