Frequency distributions show the contributions of alleles at a QTL to a complex trait
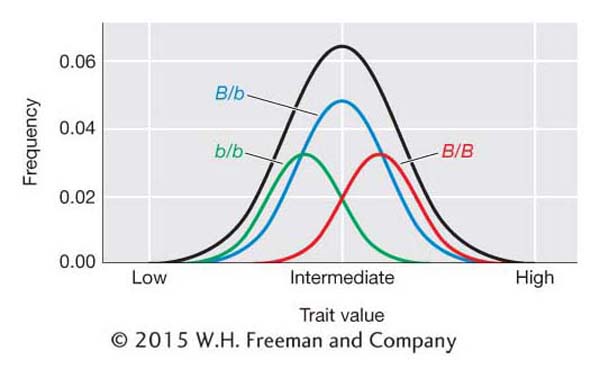
Figure 19-11: Frequency distributions showing how the distributions for the different genotypic classes at QTL locus B relate to the overall distribution for the population (black line).
[Leave] [Close]