A singl
e-
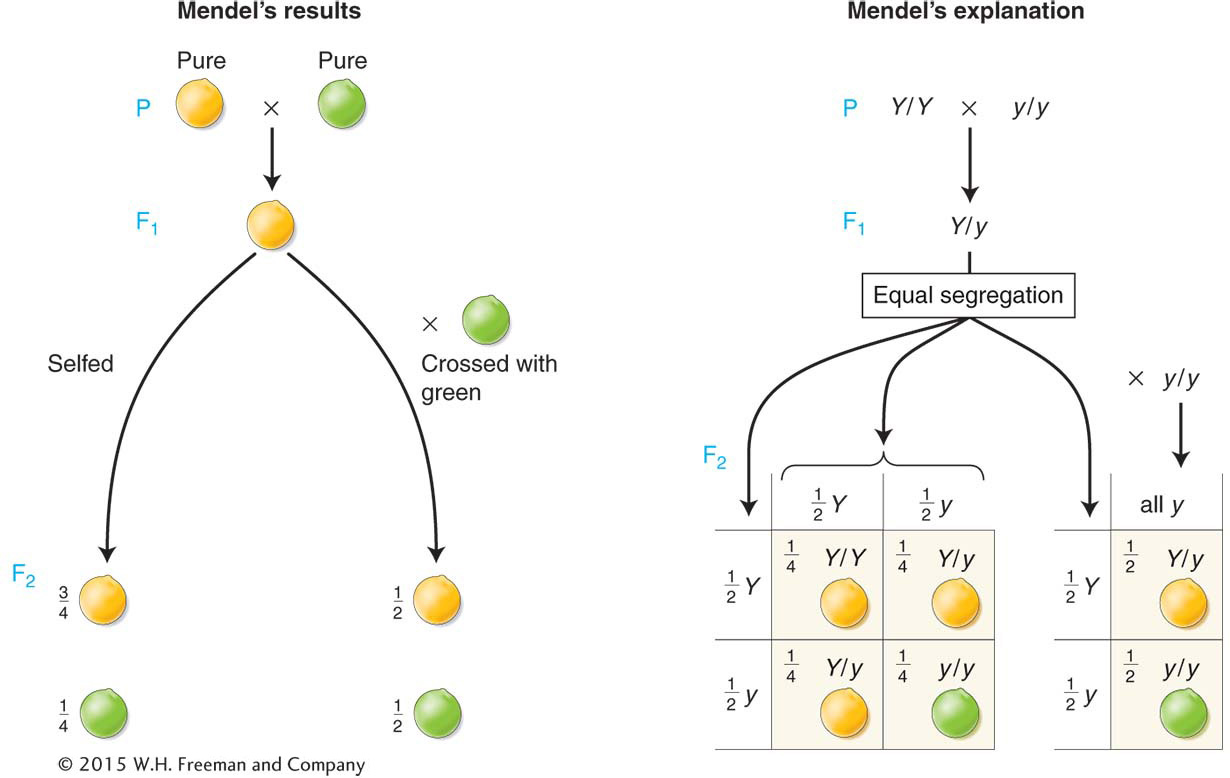
gene model explains Mendel’s ratios
Figure 2-5:
Mendel’s results (
left
) are explained by a singl
e-
gene model (
right
) that postulates the equal segregation of the members of a gene pair into gametes.
[
Leave
] [
Close
]
Next