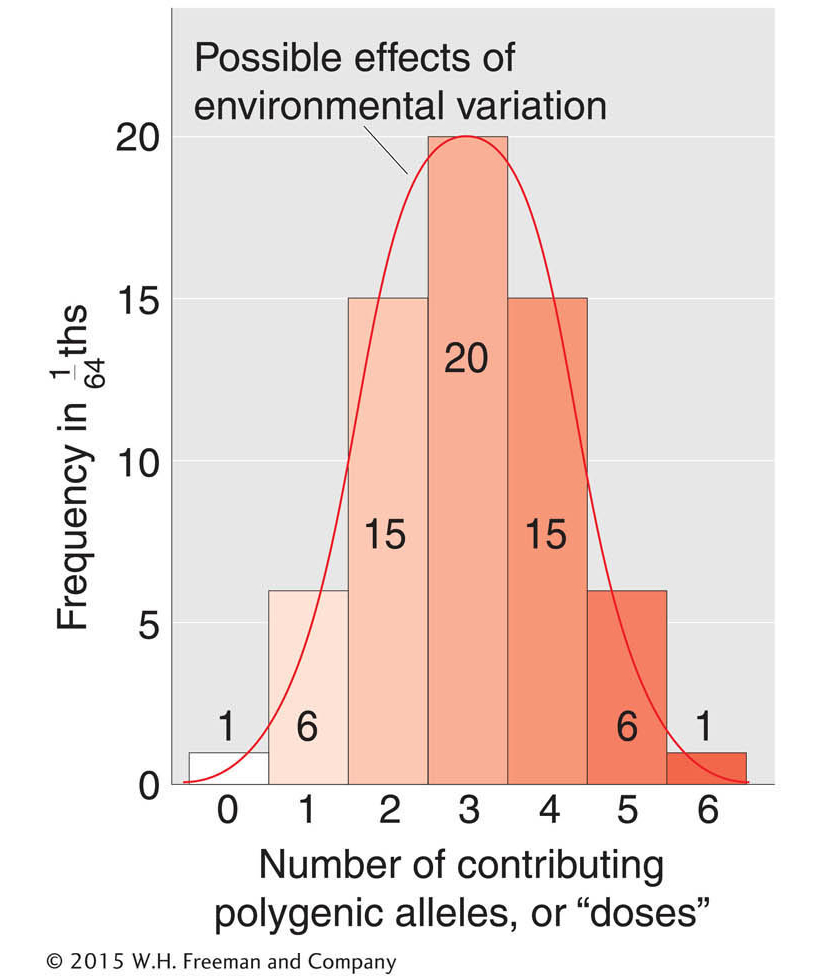
Histogram of polygenes from a trihybrid self
Figure 3-17:
The progeny of a polygene trihybrid can be graphed as a frequency histogram of contributing polygenic alleles (“doses”).
[
Leave
] [
Close
]
Next