Model for cytoplasmic segregation
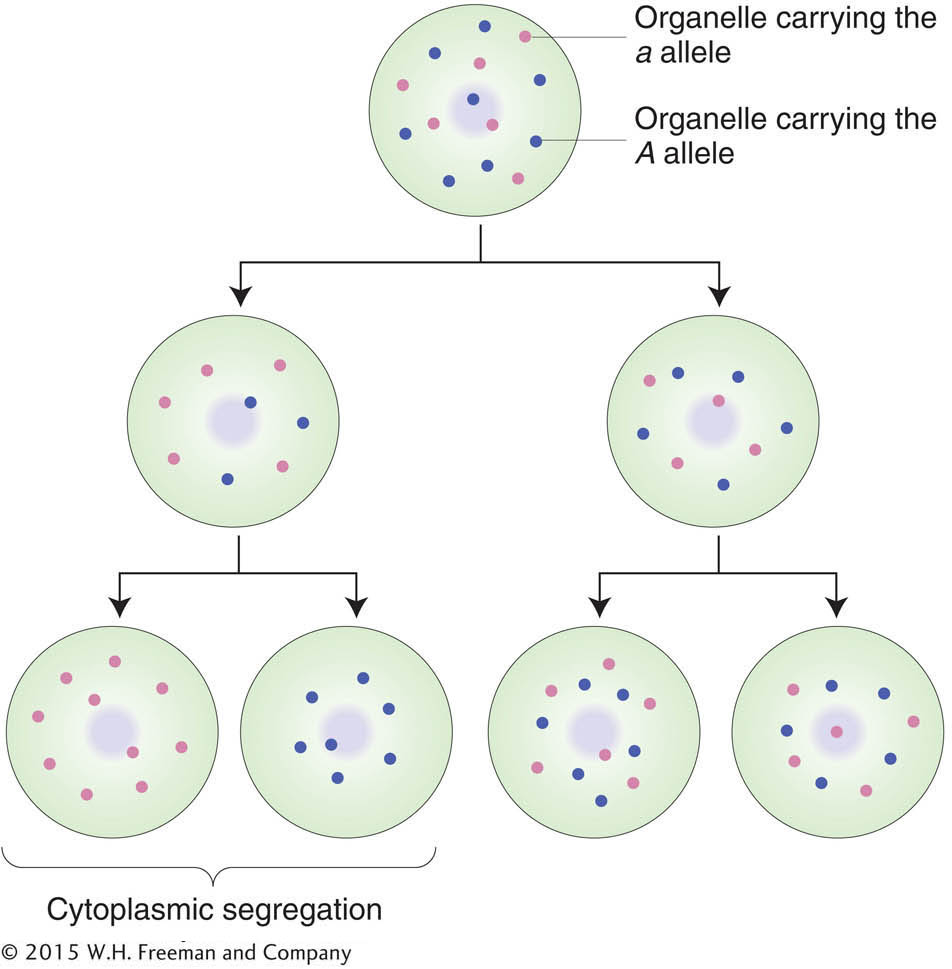
Figure 3-23: By chance, genetically distinct organelles may segregate into separate cells in a number of successive cell divisions. Red and blue dots represent genetically distinguishable organelles, such as mitochondria with and without a mutation.
[Leave] [Close]