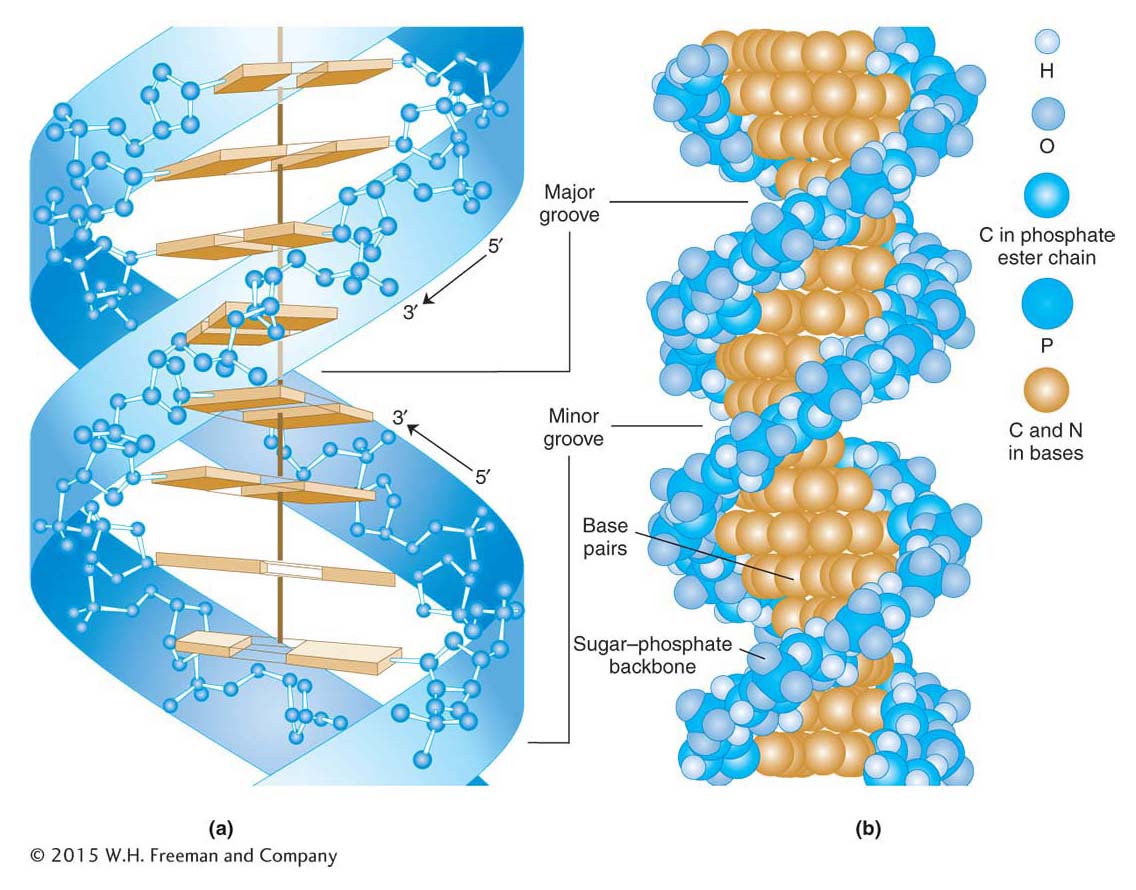
Two representations of the DNA double helix
Figure 7-9:
The ribbon diagram (a) highlights the stacking of the base pairs, whereas the spac
e-
filling model (b) shows the major and minor grooves.
[
Leave
] [
Close
]
Next