SOLVED PROBLEMS
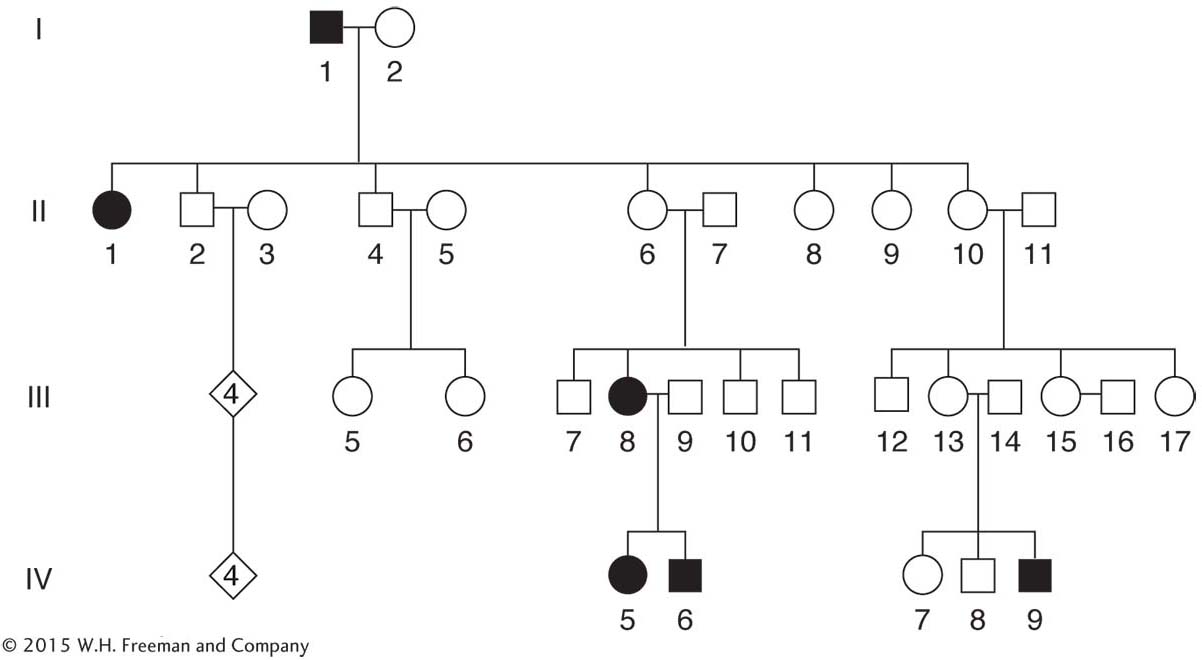
SOLVED PROBLEM 1. Most pedigrees show polydactyly (see Figure 2-25) inherited as a rare autosomal dominant, but the pedigrees of some families do not fully conform to the patterns expected for such inheritance. Such a pedigree is shown here. (The unshaded diamonds stand for the specified number of unaffected persons of unknown sex.)
What irregularity does this pedigree show?
What genetic phenomenon does this pedigree illustrate?
Suggest a specific gene-
interaction mechanism that could produce such a pedigree, showing genotypes of pertinent family members.

Solution
The normal expectation for an autosomal dominant is for each affected individual to have an affected parent, but this expectation is not seen in this pedigree, which constitutes the irregularity. What are some possible explanations?
Page 243Could some cases of polydactyly be caused by a different gene, one that is an X-
linked dominant gene? This suggestion is not useful, because we still have to explain the absence of the condition in persons II- 6 and II- 10. Furthermore, postulating recessive inheritance, whether autosomal or sex- linked, requires many people in the pedigree to be heterozygotes, which is inappropriate because polydactyly is a rare condition. Thus, we are left with the conclusion that polydactyly must sometimes be incompletely penetrant. As described in this chapter, some individuals who have the genotype for a particular phenotype do not express it. In this pedigree, II-
6 and II- 10 seem to belong in this category; they must carry the polydactyly gene inherited from I- 1 because they transmit it to their progeny. As discussed in this chapter, environmental suppression of gene expression can cause incomplete penetrance, as can suppression by another gene. To give the requested genetic explanation, we must come up with a genetic hypothesis. What do we need to explain? The key is that I-
1 passes the mutation on to two types of progeny, represented by who expresses the mutant phenotype, and by II- 6 and II- 10, who do not. (From the pedigree, we cannot tell whether the other children of I- 1 have the mutant allele.) Is genetic suppression at work? I- 1 does not have a suppressor allele because he expresses polydactyly. So the only person from whom a suppressor could come is I- 2. Furthermore, I- 2 must be heterozygous for the suppressor allele because at least one of her children does express polydactyly. Therefore, the suppressor allele must be dominant. We have thus formulated the hypothesis that the mating in generation I must have been 
where S is the suppressor and P is the allele responsible for polydactyly. From this hypothesis, we predict that the progeny will comprise the following four types if the genes assort:
|
Genotype |
Phenotype |
Example |
|---|---|---|
|
P/p · S/s |
normal (suppressed) |
II- |
|
P/p · s/s |
polydactylous |
II- |
|
p/p · S/s |
normal |
|
|
p/p · s/s |
normal |
|
If S is rare, the progeny of II-
|
Progeny genotype |
Example |
|---|---|
|
P/p · S/s |
III- |
|
P/p · s/s |
III- |
|
p/p · S/s |
|
|
p/p · s/s |
|
We cannot rule out the possibilities that II-
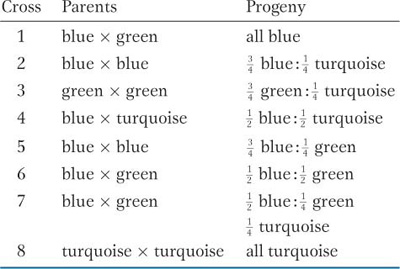
SOLVED PROBLEM 2. Beetles of a certain species may have green, blue, or turquoise wing covers. Virgin beetles were selected from a polymorphic laboratory population and mated to determine the inheritance of wing-

Deduce the genetic basis of wing-
cover color in this species. Write the genotypes of all parents and progeny as completely as possible.
Solution
These data seem complex at first, but the inheritance pattern becomes clear if we consider the crosses one at a time. A general principle of solving such problems, as we have seen, is to begin by looking over all the crosses and by grouping the data to bring out the patterns.
One clue that emerges from an overview of the data is that all the ratios are one-
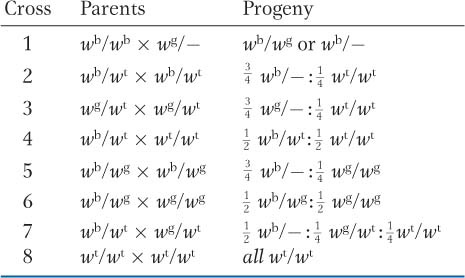
gene ratios: there is no evidence of two separate genes taking part at all. How can such variation be explained with a single gene? The answer is that there is variation for the single gene itself— that is, multiple allelism. Perhaps there are three alleles of one gene; let’s call the gene w (for wing- cover color) and represent the alleles as wg, wb, and wt. Now we have an additional problem, which is to determine the dominance of these alleles. Cross 1 tells us something about dominance because all of the progeny of a blue × green cross are blue; hence, blue appears to be dominant over green. This conclusion is supported by cross 5, because the green determinant must have been present in the parental stock to appear in the progeny. Cross 3 informs us about the turquoise determinants, which must have been present, although unexpressed, in the parental stock because there are turquoise wing covers in the progeny. So green must be dominant over turquoise. Hence, we have formed a model in which the dominance is wb > wg > wt. Indeed, the inferred position of the wt allele at the bottom of the dominance series is supported by the results of cross 7, where turquoise shows up in the progeny of a blue × green cross.
Page 244Now it is just a matter of deducing the specific genotypes. Notice that the question states that the parents were taken from a polymorphic population, which means that they could be either homozygous or heterozygous. A parent with blue wing covers, for example, might be homozygous (wb/wb) or heterozygous (wb/wg or w b/wl). Here, a little trial and error and common sense are called for, but, by this stage, the question has essentially been answered, and all that remains is to “cross the t’s and dot the i’s.” The following genotypes explain the results. A dash indicates that the genotype may be either homozygous or heterozygous in having a second allele farther down the allelic series.

SOLVED PROBLEM 3. The leaves of pineapples can be classified into three types: spiny (S), spiny tip (ST), and piping (nonspiny; P). In crosses between pure strains followed by intercrosses of the F1, the following results appeared:
|
Cross |
Parental |
Phenotypes |
|
|---|---|---|---|
|
F1 |
F2 |
||
|
1 |
ST × S |
ST |
99 ST:34S |
|
2 |
P × ST |
P |
120 P : 39 ST |
|
3 |
P × S |
P |
95 P : 25 ST : 8 S |
Assign gene symbols. Explain these results in regard to the genotypes produced and their ratios.
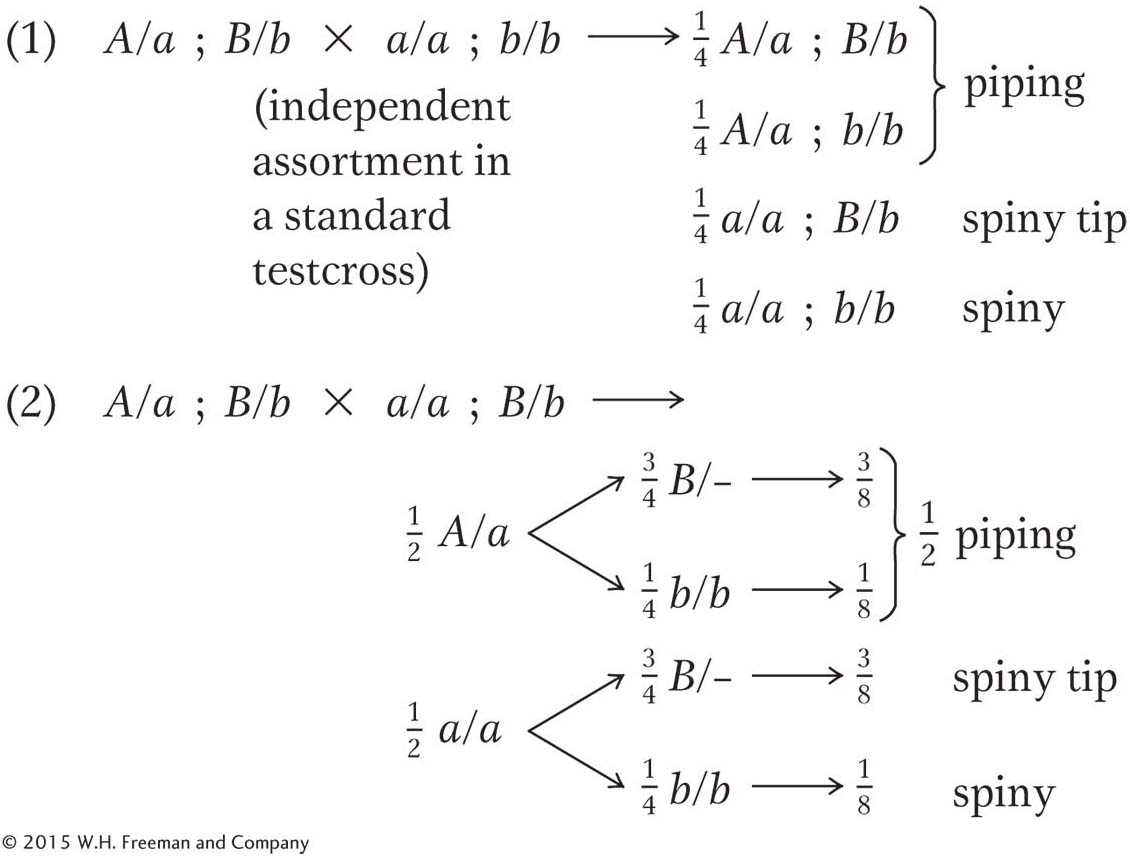
Using the model from part a, give the phenotypic ratios that you would expect if you crossed (1) the F1 progeny from piping × spiny with the spiny parental stock and (2) the F1 progeny of piping × spiny with the F1 progeny of spiny × spiny tip.
Solution
First, let’s look at the F2 ratios. We have clear 3:1 ratios in crosses 1 and 2, indicating single-
gene segregations. Cross 3, however, shows a ratio that is almost certainly a 12:3:1 ratio. How do we know this ratio? Well, there are simply not that many complex ratios in genetics, and trial and error brings us to the 12:3:1 quite quickly. In the 128 progeny total, the numbers of 96:24:8 are expected, but the actual numbers fit these expectations remarkably well. One of the principles of this chapter is that modified Mendelian ratios reveal gene interactions. Cross 3 gives F2 numbers appropriate for a modified dihybrid Mendelian ratio, and so it looks as if we are dealing with a two-
gene interaction. It seems the most promising place to start; we can return to crosses 1 and 2 and try to fit them in later. Any dihybrid ratio is based on the phenotypic proportions 9:3:3:1. Our observed modification groups them as follows:

So, without worrying about the name of the type of gene interaction (we are not asked to supply this anyway), we can already define our three pineapple-
leaf phenotypes in relation to the proposed allelic pairs A/a and B/b: 
What about the parents of cross 3? The spiny parent must be a/a; b/b, and, because the B gene is needed to produce F2 spiny-
tip leaves, the piping parent must be A/A; B/B. (Note that we are told that all parents are pure, or homozygous.) The F1 must therefore be A/a; B/b. Without further thought, we can write out cross 1 as follows:

Cross 2 can be partly written out without further thought by using our arbitrary gene symbols:

We know that the F2 of cross 2 shows single-
gene segregation, and it seems certain now that the A/a allelic pair has a role. But the B allele is needed to produce the spiny- tip phenotype, and so all plants must be homozygous B/B: Page 245
Notice that the two single-
gene segregations in crosses 1 and 2 do not show that the genes are not interacting. What is shown is that the two- gene interaction is not revealed by these crosses— only by cross 3, in which the F1 is heterozygous for both genes. Now it is simply a matter of using Mendel’s laws to predict cross outcomes:
