10.5 Aligning Genetic and Physical Maps to Isolate Specific Genes
Before complete genome sequences were available, molecular cloning of genes for genetic disorders such as cystic fibrosis (CF) or certain cancers was an arduous undertaking. Identifying cloned genes in genomic libraries often required a major research project involving the collaborative efforts of several laboratories. The process is known as positional cloning, and its strategy is to use the genetic position to isolate the gene underlying the trait. Even with the availability of entire genome sequences, it is still often necessary to first map traits that have not been associated with a gene product before identifying the gene responsible for the activity.
To initiate positional cloning, researchers need to first map the gene responsible for a particular trait. To map the gene, researchers can test for linkage with landmarks of known location, as described in Chapter 4. Landmarks might be RFLPs (restriction fragment length polymorphisms), SNPs (single nucleotide polymorphisms), or other molecular polymorphisms (see Chapters 4 and 14), or they might be well-
It is important to keep in mind that mapping a gene through any of these procedures only serves to locate the chromosomal “neighborhood” of the gene; none of these procedures directly identifies the gene. Thus, regions delimited by the molecular landmarks such as SNPs and RFLPs usually contain many genes spread over hundreds of thousands or even millions of base pairs. To identify the correct gene responsible for a particular trait, researchers need to be able to analyze the whole neighborhood for the gene of interest. In model organisms for which the entire genome sequence is available, the local neighborhood with its numerous genes can simply be obtained from a computer database (see Chapter 14). From sequence analysis of these “neighborhood” genes, most likely candidates are chosen that might represent the gene being sought.
378
Below, we will briefly discuss how positional cloning was used before the availability of the human genome sequence to isolate the gene responsible for the devastating human disease cystic fibrosis (the CF gene). While this technique is no longer necessary for identifying human genes, it is still used to identify specific genes in organisms where a genome sequence is yet to be determined.
Using positional cloning to identify a human-disease gene
Let’s follow the methods used to identify the genomic sequence of the cystic fibrosis gene. No primary biochemical defect was known at the time that the gene was isolated, and so it was very much a gene in search of a function.
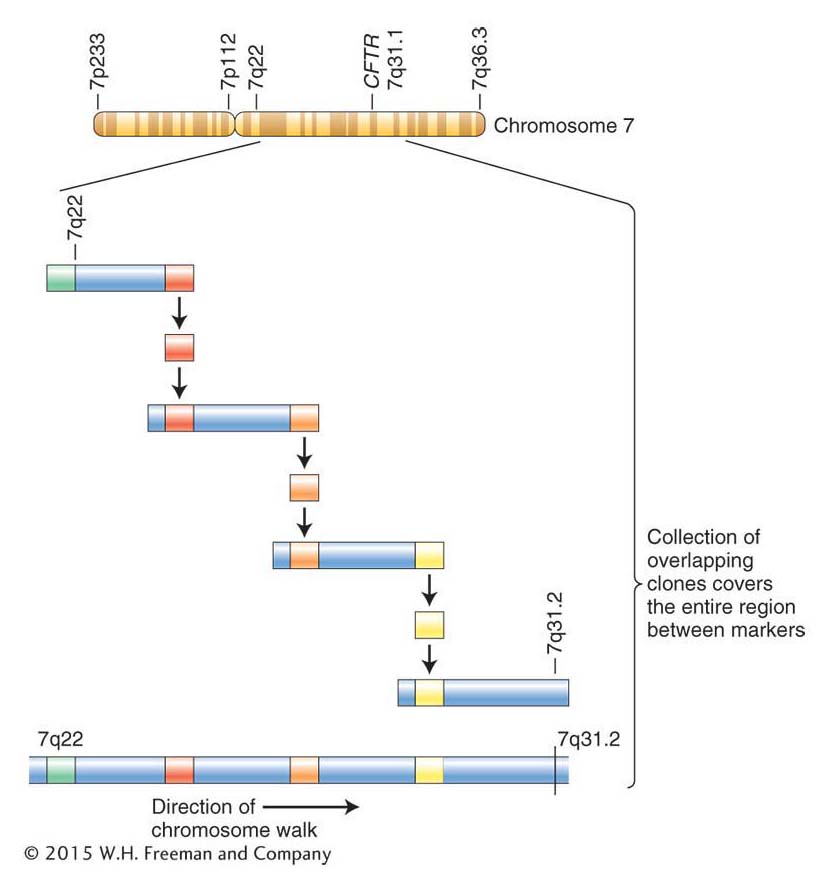
Genetic screens relying on gene mapping can be used to dissect any biological process. However, genetic screens cannot be used with human beings because we cannot intentionally create human mutants. Instead, pedigree analyses of large families with the disease trait are performed (see Chapter 2) when such information is available to determine the position of the genetic defect causing a disease such as cystic fibrosis. Members of a family carrying the disease are found to have one or more molecular markers (chromosomal abnormalities, linked traits of known location, SNPs, and so on) in common that are not found in other families (see a discussion of molecular markers in Chapter 4). Linkage to molecular markers of families carrying CF had located the CF gene to the long arm of chromosome 7, between bands 7q22 and 7q31.1. The CF gene was thought to be inside this region, but between these markers lay 1.5 centimorgans (map units) of chromosome, a vast uncharted terrain of more than 1 million bases. To get closer, it was necessary to generate more molecular markers within this region. The general method for isolating molecular markers (described in Chapter 4) is to identify a region of DNA that is polymorphic in individuals or populations that differ for the trait of interest. By finding additional molecular markers linked to the CF gene, geneticists narrowed down the region containing the CF gene to about 500 kbp, still a considerable distance.
A physical map was created of this entire region; that is, a random set of clones from this region was placed into the correct order. This was done in part by using a technique called a chromosome walk (Figure 10-19). The basic idea is to use the sequence of the nearby landmark as a probe to identify a second set of clones that overlaps the marker clone containing the landmark but extends out from it in one of two directions (toward the target or away from the target). End fragments from the new sets of clones can be used as probes for identifying a third set of overlapping clones from the genomic library. In this tedious way, geneticists identified the clone containing the molecular markers that are most tightly linked to the CF trait and sequenced that clone. With the sequence in hand, the hunt for any genes along this stretch of DNA, containing both genes and noncoding sequences, could begin.

In the CF example, candidate genes were identified by noting features, such as start and stop signals, common to genes. The sequences of candidate genes and cDNAs were then compared between normal individuals and CF patients. A mutation in a candidate gene was found that appeared in all CF patients analyzed but in none of the normal individuals. This mutation was a deletion of three base pairs, eliminating a phenylalanine from the protein. In turn, from the inferred sequence, the three-
379
Other human genes isolated by positional cloning include those involved in several heritable diseases, including Huntington disease, breast cancer, Werner syndrome (see Chapter 7), and susceptibility to asthma. Because of the relative ease of crossing plants, positional cloning has been a very powerful technique to isolate genes involved in many processes, including the identification of genes that contributed to crop domestication.
Using fine mapping to identify genes
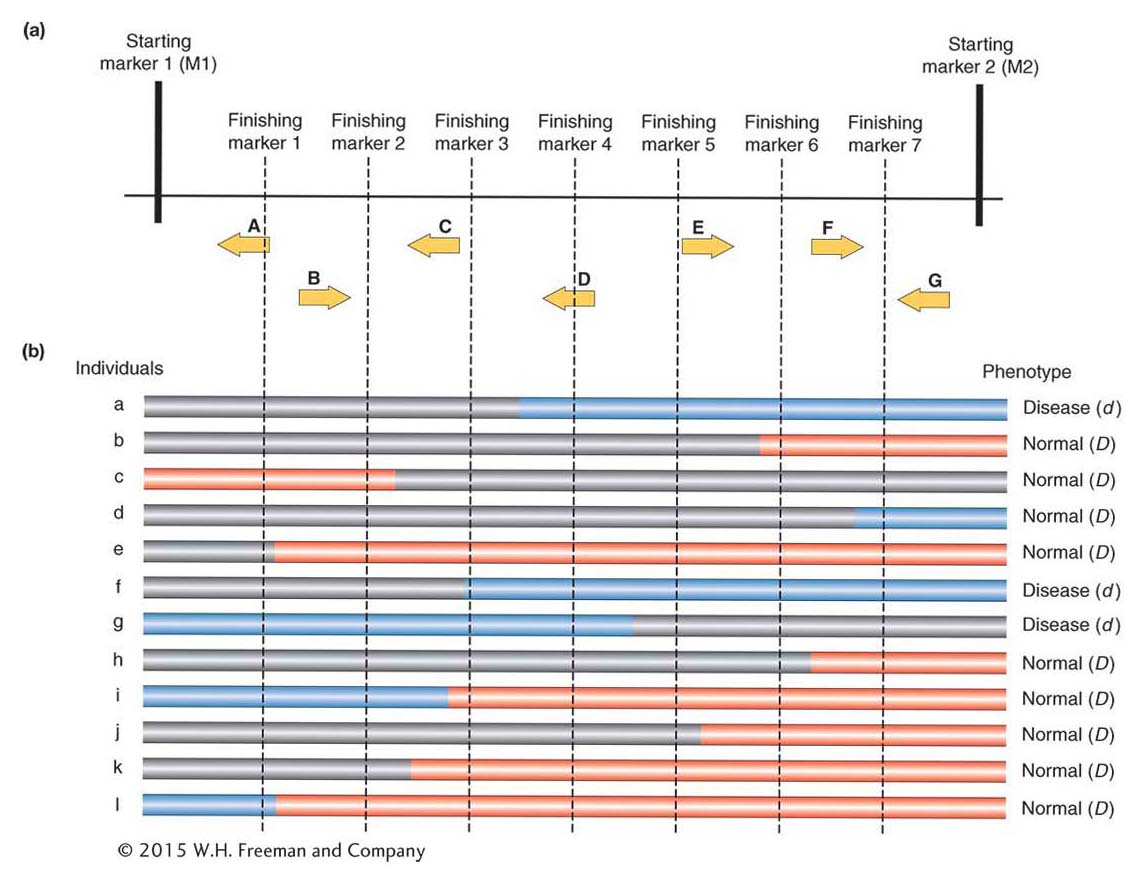
Today, the extremely tedious process of “walking” to the gene is no longer necessary for any organism for which a genome sequence is available. Researchers still begin the gene hunt by identifying two molecular markers that closely flank the gene of interest (see Figure 10-19). In Figure 10-20a, the two initial flanking markers are labeled starting marker 1 and starting marker 2. In the interval between the two starting markers, there are seven genes that are known to exist (genes A through G). Which one of these genes is responsible for the trait of interest?

380
Researchers try to narrow the interval enclosing the gene of interest. To accomplish this, they select additional markers, located in between the starting markers, from the online genome sequence and marker databases. They must select markers that have one allele in individuals with the trait phenotype and a different allele in individuals without the phenotype. These additional markers are called finishing markers; in Figure 10-20a they are finishing markers 1 to 7. The goal is to find the markers most tightly linked to the gene of interest.
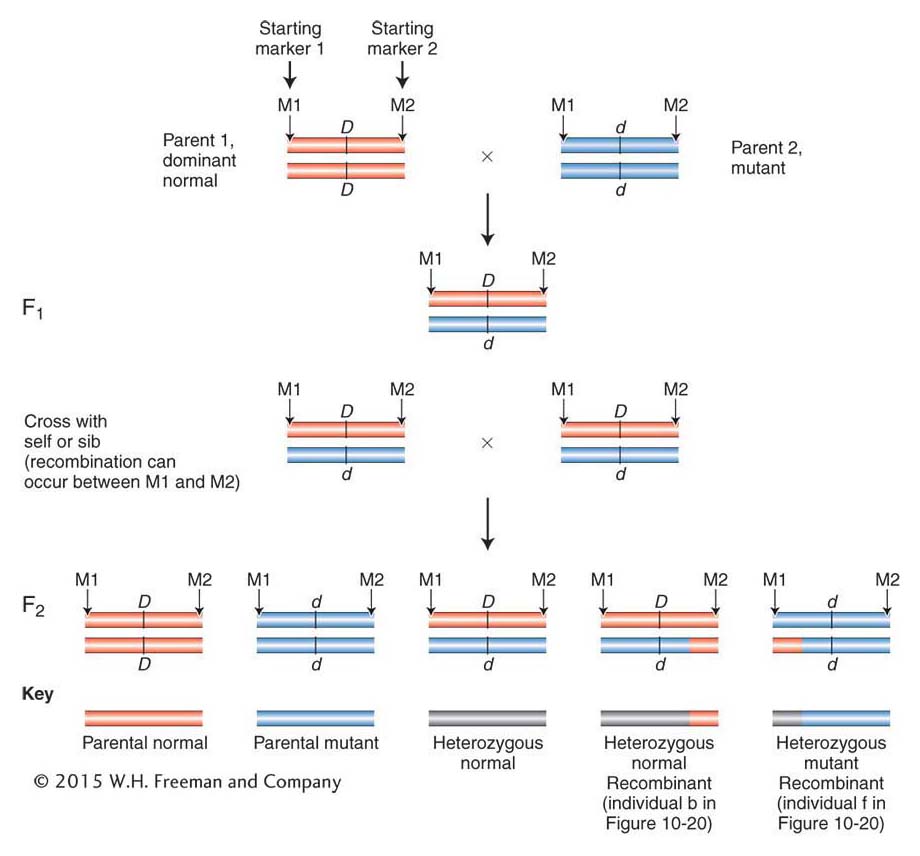
The next step is to look for individuals in which a rare crossover event occurred within the region bounded by the two starting markers. Usually, the starting markers are 1 or more centimorgans apart. As such, there will be, on average, a single crossover in an interval of this size in 100 progeny. Because of the large number of progeny required, this type of mapping has been applied successfully in many model genetic organisms (such as the fruit fly and C. elegans) but is especially successful in plants because plant crosses can produce hundreds or thousands of progeny that can be obtained and analyzed. Figure 10-21 shows the series of crosses used to produce progeny containing recombinants between starting markers M1 and M2 (see Figure 10-20).

The marker alleles reveal whether the markers, and the genes within the same region, were inherited from the mother or the father. In the recombinants, part of the stretch between the starting markers on one chromosome will have been inherited from the mother and part from the father (Parent 2 in Figure 10-21). In Figure 10-20, the trait is a disease inherited from the father. In individuals with the disease, the crossover has created a region, colored blue in Figure 10-20b, that is homozygous for the disease gene. Thus, the gene must lie within the blue region in all individuals with the disease. Comparing all individuals with the disease, you can see that the only blue region shared by all of them is the region where gene D resides.
381
In other words, D is the one gene present in regions of the genome that are homozygous for the paternal allele in individuals with the disease. If the number of individuals in the pedigrees or study populations is sufficiently large, then it may be possible to identify not only the gene in question but also the disease lesion, which is the polymorphic site within the gene that controls the trait difference. Notice that this process does not involve either cloning bits of DNA into BAC libraries or screening such libraries. As such, it is more appropriately referred to as fine mapping rather than positional cloning.
Investigators still must work very hard and overcome many hurdles to isolate the genes that control disease conditions or other traits. First, they need to have large samples of individuals to ensure that they can identify rare crossover events between all the genes. Typically, this means having thousands of individuals. Without large populations, investigators might recover crossovers only every several genes or so and consequently would not be certain which of these was the causative gene. For example, with only individuals a and b in Figure 10-20b, an investigator could only narrow the search to four genes (D, E, F, G). Second, although online databases contain lists of DNA-
382
KEY CONCEPT
Even with access to the sequences of entire genomes, the isolation of defective disease-The preceding sections have introduced the fundamental techniques that have revolutionized genetics. The final section of this chapter will focus on the application of these techniques to genetic engineering.