Chapter 4. Positive and Negative Correlations
Positive and Negative Correlations
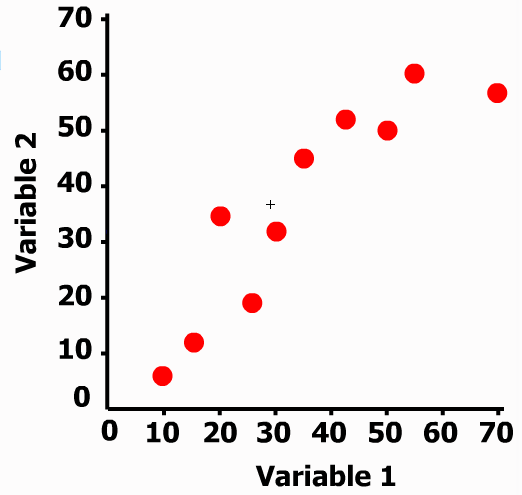
A correlation describes a relationship between two variables. Correlations are usually shown on a graph called a scatterplot. Each point on a scatterplot represents a single person or thing.
We can construct a scatterplot from the scores in the table below.
| Students | Variable 1 | Variable 2 |
| Harumi | 30 | 32 |
| Amy | 10 | 5 |
| Hans | 25 | 20 |
| Sally | 70 | 57 |
| Jamal | 20 | 35 |
| Heather | 35 | 45 |
| John | 15 | 12 |
| Keiko | 42 | 52 |
| Lech | 50 | 50 |
| Musaf | 55 | 60 |
The Language of Experiments
A correlation coefficient (r) is a precise measure of the strength of the relationship between the two variables. The relationship can take three forms: positive correlation (r up to +1.0), negative correlation (r as low as -1.0) or no correlation (r near zero).
Correlation: Positive
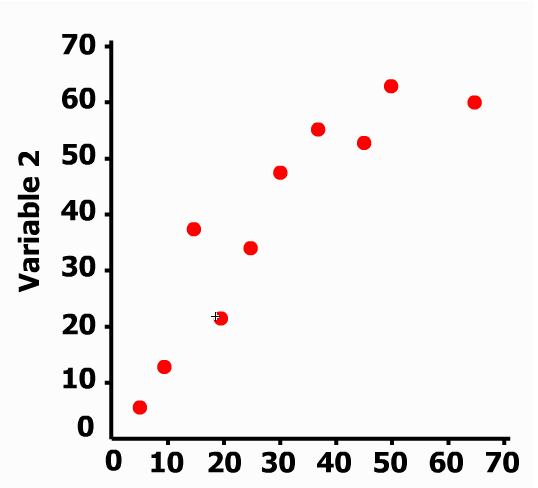
This scatterplot shows a strong positive correlation.
People who scored high on Variable 1 tended to also have high scores on Variable 2, and vice versa.
r = +0.91.
Correlation: Negative
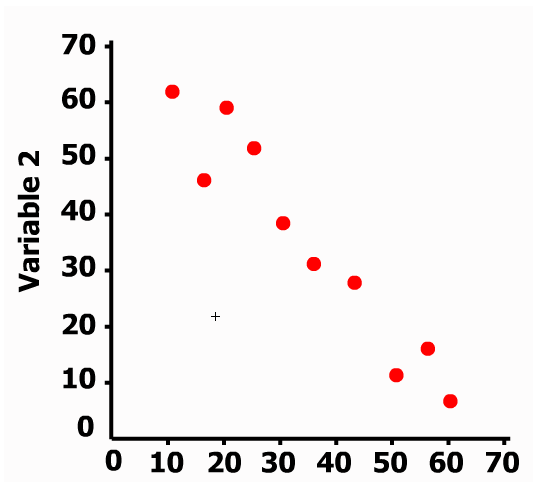
This scatterplot shows a strong negative correlation.
People who scored high on Variable 1 tended to have low scores on Variable 2.
r = -0.96.
Correlation: None
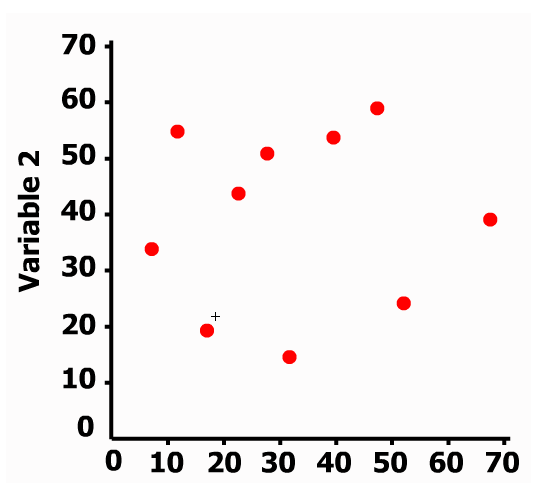
This scatterplot shows no correlation between the two variables.
r = +0.03 (near zero)
Positive and Negative Correlations
No Correlation
| Variable 1 | Variable 2 | |
| Person 1 | 7 | 34 |
| Person 2 | 12 | 55 |
| Person 3 | 17 | 19 |
| Person 4 | 25 | 42 |
| Person 5 | 40 | 54 |
| Person 6 | 32 | 13 |
| Person 7 | 48 | 60 |
| Person 8 | 52 | 25 |
| Person 9 | 70 | 40 |
The Language of Experiments
Correlation is a measure of the strength of the relationship between two variables - that is, the extent to which scores on the two variables go up or down together. Two variables are positively correlated if they systematically vary in the same direction, increasing and decreasing together. A person with a high score on the first variable would also tend to have a high score on the second variable. Two variables are negatively correlated if they vary systematically in the opposite direction, with one increasing while the other decreases. A person with a high score on the one variable would tend to have a low score on the other variable. If two variables have no correlation, a person with a high score on one variable is equally likely to have either a high or a low score on the other variable. If two variables are correlated (either positively or negatively), then a person's score on one variable can be used to predict the score on the other variable.
The Language of Experiments
QUESTION: What correlation is shown in the scatterplot above?
The Language of Experiments
QUESTION: What correlation is shown in the scatterplot above?
The Language of Experiments
QUESTION: What correlation is shown in the scatterplot above?