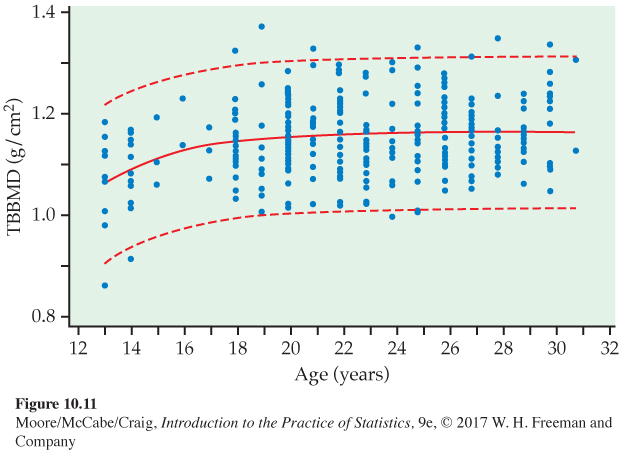
FIGURE 10.11
Plot of total body bone mineral density versus age,
Example 10.14
[
Leave
] [
Close
]
Next