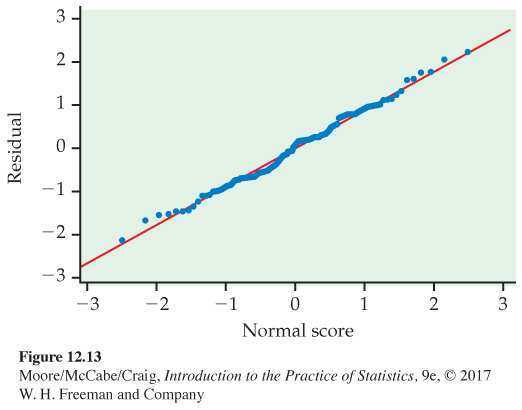
FIGURE 12.13
Normal quantile plot of residuals for the transformed response,
Example 12.17
.
[
Leave
] [
Close
]
Next