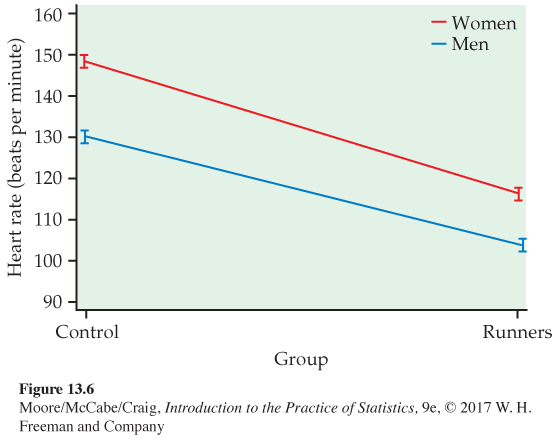
FIGURE 13.6
Plot of the group means, with standard errors indicated, for heart rates in the 2 × 2 ANOVA,
Example 13.8
.
[
Leave
] [
Close
]
Next