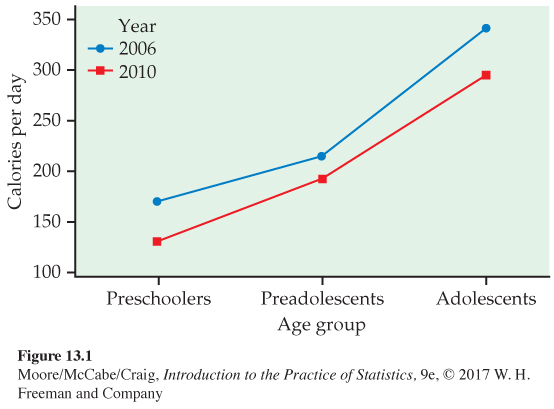
FIGURE 13.1
Plot of the mean calories in suga
r-
sweetened beverages consumed per day in 2003 to 2006 and 2007 to 2010 for different age groups,
Example 13.5
.