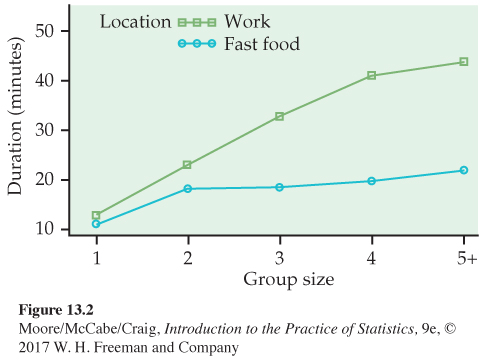
FIGURE 13.2
Plot of mean meal duration versus lunch setting and group size,
Example 13.6
.
[
Leave
] [
Close
]
Next