EXAMPLE 2.25
fidget
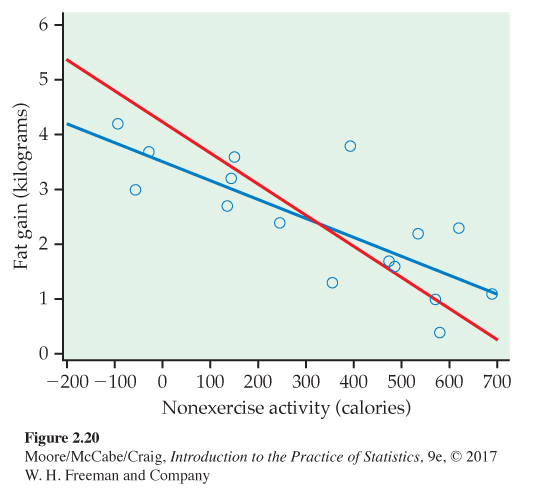
Fidgeting and fat gain. Figure 2.20 is a scatterplot of the fidgeting and fat gain data described in Example 2.19 (page 107). There is a negative linear relationship. The two lines on the plot are the two least-squares regression lines. The regression line using nonexercise activity to predict fat gain is blue. The regression line using fat gain to predict nonexercise activity is red. Regression of fat gain on nonexercise activity and regression of nonexercise activity on fat gain give different lines. In the regression setting, you must decide which variable is explanatory.
Figure 2.20 Scatterplot of fat gain versus nonexercise activity for 16 subjects from Example 2.19. The two lines are the two least-squares regression lines, using nonexercise activity to predict fat gain (blue) and using fat gain to predict nonexercise activity (red), Example 2.25.
[Leave] [Close]