EXAMPLE 2.27
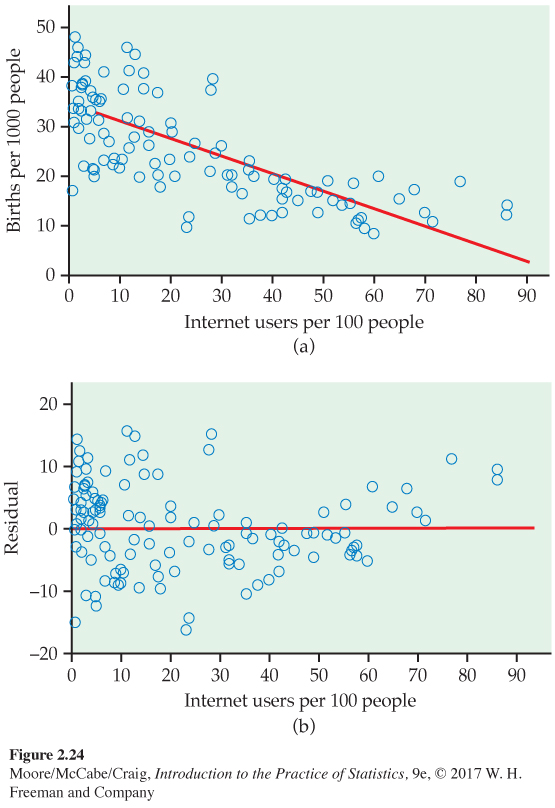
Patterns in birthrate and Internet user residuals. In Exercise 2.34 (page 99) we used a scatterplot to study the relationship between birthrate and Internet users for 106 countries. In this scatterplot, Figure 2.13, we see that there are many countries with low numbers of Internet users. In addition, the relationship between births and Internet users appears to be curved. For low values of Internet users, there is a clear relationship, while for higher values, the curve becomes relatively flat.
Figure 2.24(a) gives the data with the least-squares regression line, and Figure 2.24(b) plots the residuals. Look at the right part of Figure 2.24(b), where the values of Internet users are high. Here we see that the residuals tend to be positive.
