EXAMPLE 2.29
Influential observations. Subjects 15 and 18 both influence the correlation between FPG and HbA1c, in opposite directions. Subject 15 weakens the linear pattern; if we drop this point, the correlation increases from r = 0.4819 to r = 0.5684. Subject 18 extends the linear pattern; if we omit this subject, the correlation drops from r = 0.4819 to r = 0.3837.
Page 129
To assess influence on the least-squares line, we recalculate the line leaving out a suspicious point. Figure 2.26 shows three least-squares lines. The solid line is the regression line of FPG on HbA1c based on all 18 subjects. This is the same line that appears in Figure 2.25(a). The dotted line is calculated from all subjects except Subject 18. You see that point 18 does pull the line down toward itself. But the influence of Subject 18 is not very large—the dotted and solid lines are close together for HbA1c values between 6 and 14, the range of all except Subject 18.
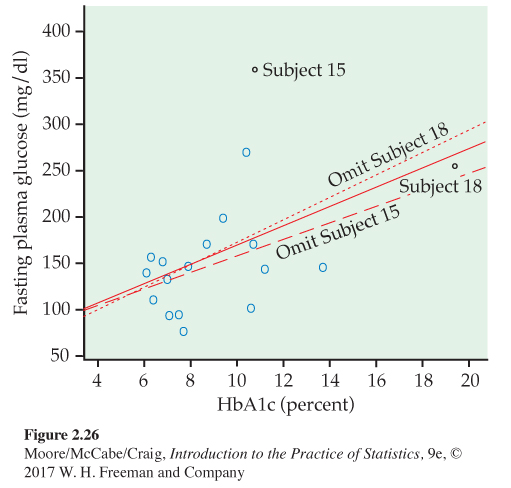
The dashed line omits Subject 15, the outlier in y. Comparing the solid and dashed lines, we see that Subject 15 pulls the regression line up. The influence is again not large, but it exceeds the influence of Subject 18.