EXAMPLE 2.9
Laundry detergents. A higher price for a product should be associated with a better product. Therefore, let’s treat price per load as the explanatory variable and rating as the response variable in our examination of the relationship between these two variables. We begin with a graphical display.
Figure 2.1 gives a scatterplot that displays the relationship between the response variable, rating, and the explanatory variable, price per load. The most striking feature that we see in the plot is a case that appears to be very different from the others. One of the laundry detergents has a rating that is about average (51), but the price per load (56 cents) is almost double that of the other products.
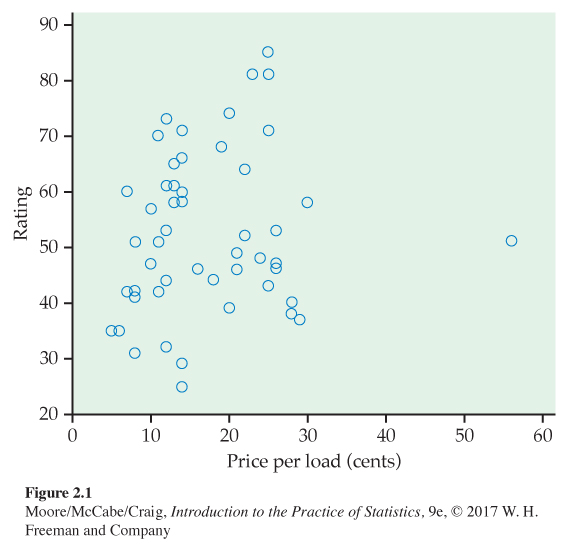
Cases that fall well outside the general pattern of the relationship are called outliers. We provide a more detailed description of these in Section 2.5. For now, we remove this case and focus on the relationship of the remaining data.
Figure 2.2 gives the scatterplot with the outlier removed. The relationship is weak. Paying a high price for your laundry detergent will not guarantee that you have selected a highly rated product.