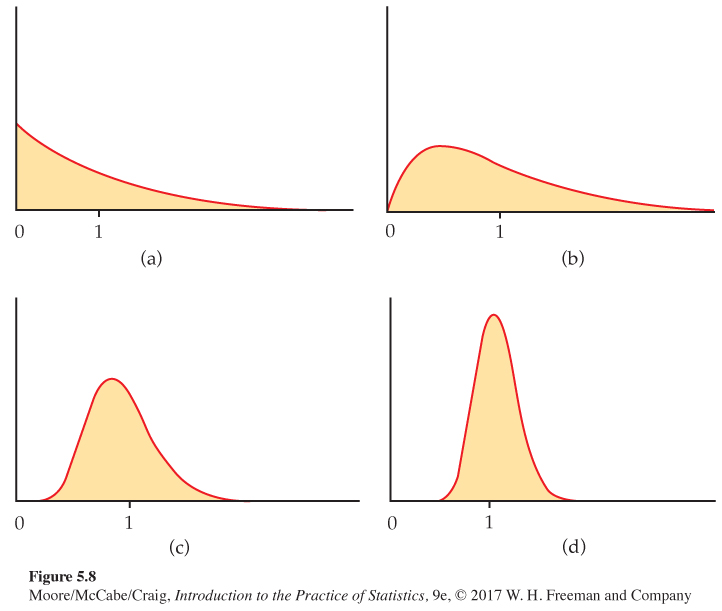
Figure 5.8: Figure 5.8 The central limit theorem in action: the sampling distribution of sample means from a strongly non-Normal population becomes more Normal as the sample size increases, Example 5.9. (a) The distribution of 1 observation. (b) The distribution of ˉx for 2 observations. (c) The distribution of ˉx for 10 observations. (d) The distribution of ˉx for 25 observations.
[Leave] [Close]