Loading [MathJax]/jax/output/CommonHTML/jax.js
Figure 6.3:
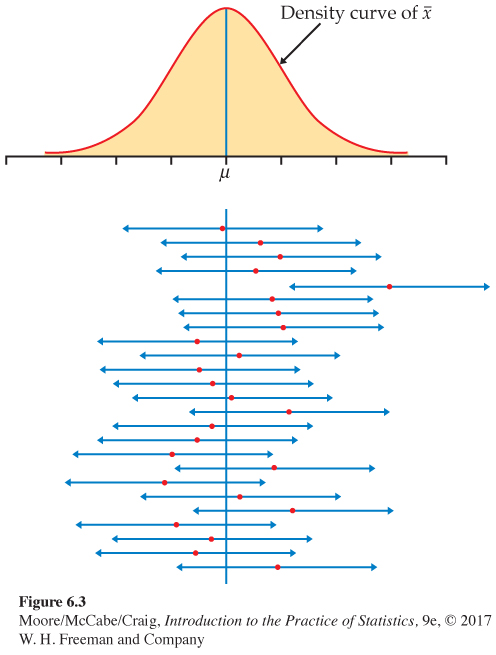
FIGURE 6.3
Twenty-five samples from the same population gave these 95% confidence intervals. In the long run, 95% of all samples give an interval that covers
μ
. The sampling distribution of
ˉ
x
is shown at the top.
[
Leave
] [
Close
]
Next