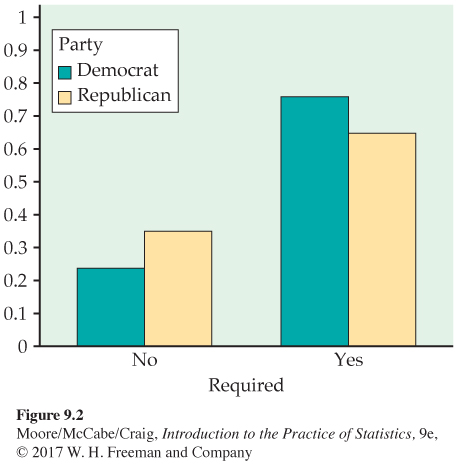
FIGURE 9.2
Bar graph of the percents of adults who believe vaccinations should not be required (no) and who believe that vaccinations should be required (yes), by political party preference,
Example 9.5
.
[
Leave
] [
Close
]
Next