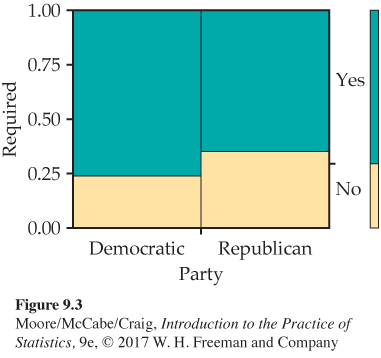
FIGURE 9.3
Mosaic plot for the vaccinations and political party data,
Example 9.6
.
[
Leave
] [
Close
]
Next